
Created
: 2025.07.09


![]() 2025.07.09 20:48
2025.07.09 20:48
Gold (XAU/USD) is extending its decline on Wednesday for a second consecutive day as the US Dollar (USD) and US Treasury yields firm ahead of the release of the Federal Open Market Committee (FOMC) Meeting Minutes.
The US Dollar Index (DXY) is rising to its highest level in two weeks, pushing XAU/USD below $3,300 at the time of writing.
The upcoming release of the FOMC Minutes from the June meeting is expected to shed light on the Fed's internal debate over the path of monetary policy.
In June, the central bank opted to maintain its benchmark interest rate at 4.25% to 4.50%, citing a resilient labor market and lingering inflation pressures.
Last week's Nonfarm Payrolls (NFP) report reinforced that outlook, showing continued strength in employment and reducing expectations for a near-term rate cut. As a result, yields have firmed across the curve, further strengthening the USD and weighing on Gold.
Gold typically shares an inverse relationship with the US Dollar and interest rates. When yields rise, interest-bearing assets become more attractive relative to Gold, which does not offer a yield. This dynamic has continued to pressure bullion in recent sessions.
Letters outlining the reciprocal tariff rates that the Trump administration aims to impose on imports to the US continue to be sent to trading partners of the World's largest economy.
This has reignited concerns over the potential economic implications of the levy increase.
The latest news that the European Union (EU) and the United States (US) are making progress in trade talks has provided additional support for the Greenback.
However, with the new rates expected to take effect from August, the three-week extension has increased the hopes that more trade deals between the US and its major counterparts could be announced. This has weakened the short-term appeal of bullion.
Gold (XAU/USD) is under renewed pressure on Wednesday, with the price threatening the lower boundary of a symmetrical triangle pattern.
The daily candle is trading just beneath the 38.2% Fibonacci retracement level at $3,292 of the April rally, which has served as a key short-term support level over recent weeks.
Gold (XAU/USD) daily chart
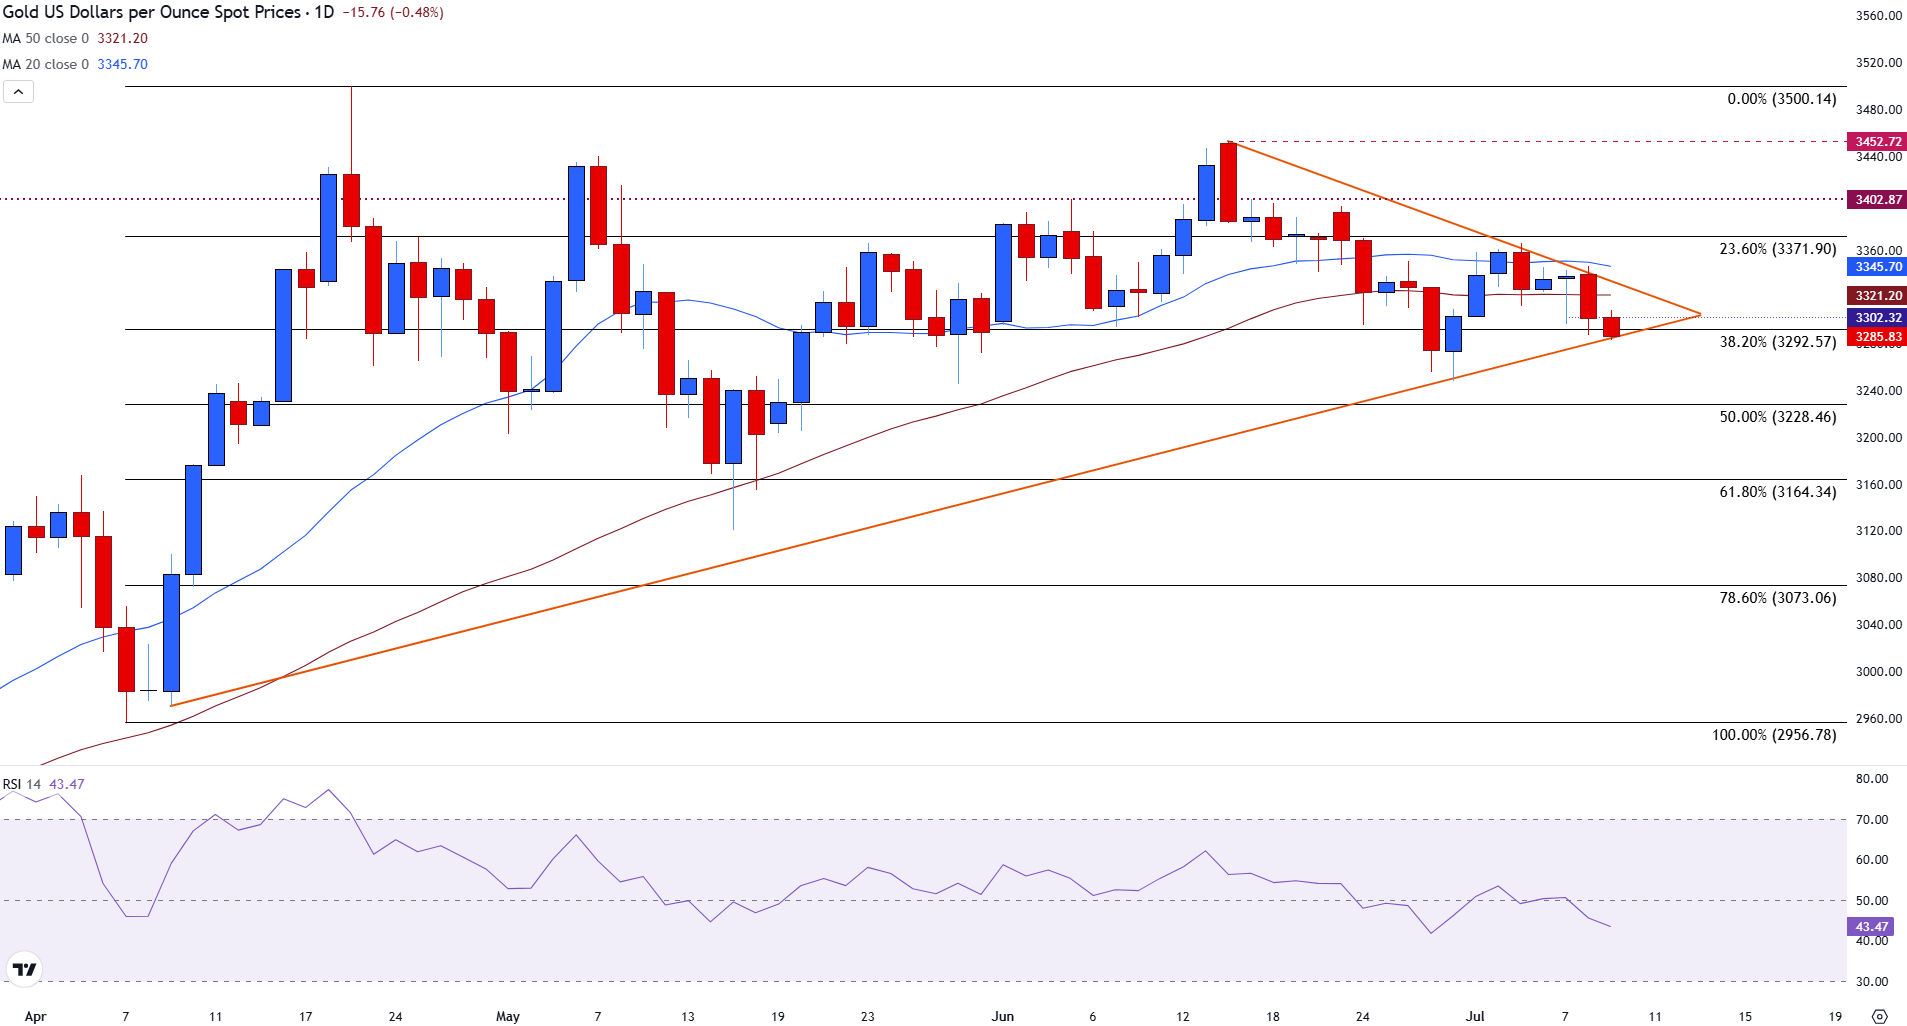
A sustained move below this level could expose Gold to further losses, targeting the 50% Fibo level at $3,228, followed by $3,164.
On the upside, resistance is aligned at the 50-day Simple Moving Average (SMA) at $3,321 and the 20-day SMA at $3,345.
The 23.6% retracement level is providing an additional barrier of resistance at $3,372, with a move higher opening the door for the $3,400 round number.
The Relative Strength Index (RSI) is holding near 44, reinforcing the emergence of bearish momentum.
The metal's failure to hold above its moving averages and the triangle apex favour downside continuation, unless bulls can convincingly gain traction above $3,345.
The table below shows the percentage change of US Dollar (USD) against listed major currencies today. US Dollar was the strongest against the Canadian Dollar.
| USD | EUR | GBP | JPY | CAD | AUD | NZD | CHF | |
|---|---|---|---|---|---|---|---|---|
| USD | 0.16% | 0.00% | 0.00% | 0.20% | -0.02% | 0.02% | -0.08% | |
| EUR | -0.16% | -0.14% | -0.15% | 0.05% | -0.14% | -0.14% | -0.12% | |
| GBP | -0.01% | 0.14% | 0.02% | 0.19% | -0.08% | -0.06% | -0.07% | |
| JPY | 0.00% | 0.15% | -0.02% | 0.15% | -0.03% | 0.00% | -0.07% | |
| CAD | -0.20% | -0.05% | -0.19% | -0.15% | -0.16% | -0.17% | -0.16% | |
| AUD | 0.02% | 0.14% | 0.08% | 0.03% | 0.16% | 0.00% | 0.03% | |
| NZD | -0.02% | 0.14% | 0.06% | -0.00% | 0.17% | -0.00% | -0.01% | |
| CHF | 0.08% | 0.12% | 0.07% | 0.07% | 0.16% | -0.03% | 0.01% |
The heat map shows percentage changes of major currencies against each other. The base currency is picked from the left column, while the quote currency is picked from the top row. For example, if you pick the US Dollar from the left column and move along the horizontal line to the Japanese Yen, the percentage change displayed in the box will represent USD (base)/JPY (quote).
Gold has played a key role in human's history as it has been widely used as a store of value and medium of exchange. Currently, apart from its shine and usage for jewelry, the precious metal is widely seen as a safe-haven asset, meaning that it is considered a good investment during turbulent times. Gold is also widely seen as a hedge against inflation and against depreciating currencies as it doesn't rely on any specific issuer or government.
Central banks are the biggest Gold holders. In their aim to support their currencies in turbulent times, central banks tend to diversify their reserves and buy Gold to improve the perceived strength of the economy and the currency. High Gold reserves can be a source of trust for a country's solvency. Central banks added 1,136 tonnes of Gold worth around $70 billion to their reserves in 2022, according to data from the World Gold Council. This is the highest yearly purchase since records began. Central banks from emerging economies such as China, India and Turkey are quickly increasing their Gold reserves.
Gold has an inverse correlation with the US Dollar and US Treasuries, which are both major reserve and safe-haven assets. When the Dollar depreciates, Gold tends to rise, enabling investors and central banks to diversify their assets in turbulent times. Gold is also inversely correlated with risk assets. A rally in the stock market tends to weaken Gold price, while sell-offs in riskier markets tend to favor the precious metal.
The price can move due to a wide range of factors. Geopolitical instability or fears of a deep recession can quickly make Gold price escalate due to its safe-haven status. As a yield-less asset, Gold tends to rise with lower interest rates, while higher cost of money usually weighs down on the yellow metal. Still, most moves depend on how the US Dollar (USD) behaves as the asset is priced in dollars (XAU/USD). A strong Dollar tends to keep the price of Gold controlled, whereas a weaker Dollar is likely to push Gold prices up.
![]()
Created
: 2025.07.09
![]()
Last updated
: 2025.07.09

FXStreet is a forex information website, delivering market analysis and news articles 24/7.
It features a number of articles contributed by well-known analysts, in addition to the ones by its editorial team.
Founded in 2000 by Francesc Riverola, a Spanish economist, it has grown to become a world-renowned information website.
We hope you find this article useful. Any comments or suggestions will be greatly appreciated.
We are also looking for writers with extensive experience in forex and crypto to join us.
please contact us at [email protected].
Disclaimer:![]()
All information and content provided on this website is provided for informational purposes only and is not intended to solicit any investment. Although all efforts are made in order to ensure that the information is correct, no guarantee is provided for the accuracy of any content on this website. Any decision made shall be the responsibility of the investor and Myforex does not take any responsibility whatsoever regarding the use of any information provided herein.
The content provided on this website belongs to Myforex and, where stated, the relevant licensors. All rights are reserved by Myforex and the relevant licensors, and no content of this website, whether in full or in part, shall be copied or displayed elsewhere without the explicit written permission of the relevant copyright holder. If you wish to use any part of the content provided on this website, please ensure that you contact Myforex.
Myforex uses cookies to improve the convenience and functionality of this website. This website may include cookies not only by us but also by third parties (advertisers, log analysts, etc.) for the purpose of tracking the activities of users. Cookie policy
