
Created
: 2025.06.11


![]() 2025.06.11 21:00
2025.06.11 21:00
Gold (XAU/USD) is trading higher during the European session on Wednesday as investors adopt a cautious stance ahead of key US inflation data. The precious metal gains modest ground, hovering above $3,330 at the time of writing.
Market participants are closely watching the upcoming May US Consumer Price Index (CPI) release on Wednesday, which is expected to provide critical insight into inflation dynamics and Federal Reserve (Fed) monetary policy.
Consensus forecasts suggest that US headline inflation accelerated to an annual rate of 2.5% in May, up from the 2.3% increase seen in April. During the same period, core CPI inflation, which excludes the volatile food and energy prices, is expected to tick up to 2.9% from 2.8%.
Rising inflation and the prospect of higher interest rates by the Fed typically support the US Dollar (USD), weighing on non-yielding assets like Gold.
Gold price is currently holding above the $3,300 mark, hovering around $3,330 at the time of writing, as the market finds short-term support in this range.
On the upside, resistance is forming near the psychological level of $3,350, and a break above this barrier could pave the way for a move toward Friday's high of around $3,375.
Further up, the $3,400 psychological level limited the bullish potential last week. If buyers clear this zone and bullish momentum gains traction, a move toward the April all-time high at $3,500 may be possible.
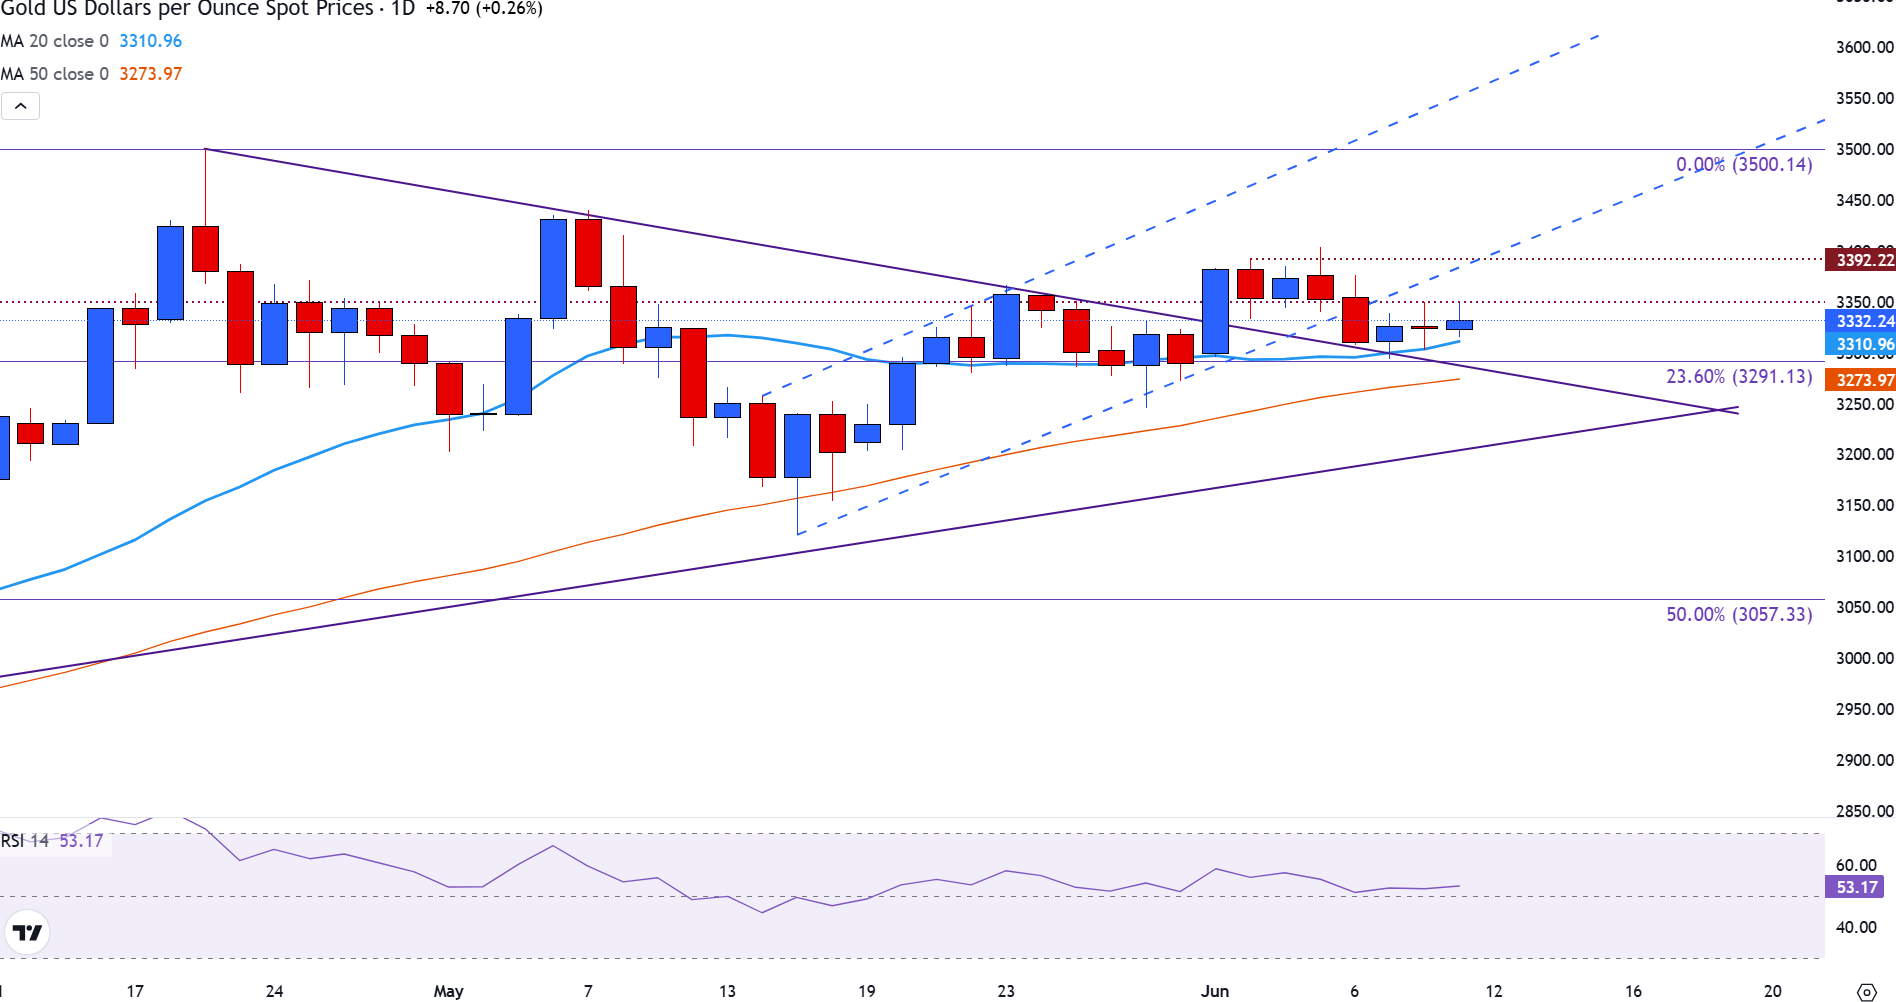
However, the Relative Strength Index (RSI) indicator flattens near the neutral zone of 50 on the daily chart, signalling a lack of momentum and indecision among traders.
In the event of a downside move, the immediate support for the Gold price is at the 20-day Simple Moving Average (SMA) at $3,310, just above the next psychological support zone of the $3,300 mark, and ahead of the 23.6% Fibonacci retracement level of the January-April rise at $3,291.
Further down, the 50-day SMA could then provide an additional layer of support around $3,275, while the tip of a symmetrical triangle chart pattern could provide another important cushion for downside price action at $3,240.
Inflationary or deflationary tendencies are measured by periodically summing the prices of a basket of representative goods and services and presenting the data as The Consumer Price Index (CPI). CPI data is compiled on a monthly basis and released by the US Department of Labor Statistics. The YoY reading compares the prices of goods in the reference month to the same month a year earlier.The CPI is a key indicator to measure inflation and changes in purchasing trends. Generally speaking, a high reading is seen as bullish for the US Dollar (USD), while a low reading is seen as bearish.
Read more.Next release: Wed Jun 11, 2025 12:30
Frequency: Monthly
Consensus: 2.5%
Previous: 2.3%
Source: US Bureau of Labor Statistics
The US Federal Reserve (Fed) has a dual mandate of maintaining price stability and maximum employment. According to such mandate, inflation should be at around 2% YoY and has become the weakest pillar of the central bank's directive ever since the world suffered a pandemic, which extends to these days. Price pressures keep rising amid supply-chain issues and bottlenecks, with the Consumer Price Index (CPI) hanging at multi-decade highs. The Fed has already taken measures to tame inflation and is expected to maintain an aggressive stance in the foreseeable future.
![]()
Created
: 2025.06.11
![]()
Last updated
: 2025.06.11

FXStreet is a forex information website, delivering market analysis and news articles 24/7.
It features a number of articles contributed by well-known analysts, in addition to the ones by its editorial team.
Founded in 2000 by Francesc Riverola, a Spanish economist, it has grown to become a world-renowned information website.
We hope you find this article useful. Any comments or suggestions will be greatly appreciated.
We are also looking for writers with extensive experience in forex and crypto to join us.
please contact us at [email protected].
Disclaimer:![]()
All information and content provided on this website is provided for informational purposes only and is not intended to solicit any investment. Although all efforts are made in order to ensure that the information is correct, no guarantee is provided for the accuracy of any content on this website. Any decision made shall be the responsibility of the investor and Myforex does not take any responsibility whatsoever regarding the use of any information provided herein.
The content provided on this website belongs to Myforex and, where stated, the relevant licensors. All rights are reserved by Myforex and the relevant licensors, and no content of this website, whether in full or in part, shall be copied or displayed elsewhere without the explicit written permission of the relevant copyright holder. If you wish to use any part of the content provided on this website, please ensure that you contact Myforex.
Myforex uses cookies to improve the convenience and functionality of this website. This website may include cookies not only by us but also by third parties (advertisers, log analysts, etc.) for the purpose of tracking the activities of users. Cookie policy
