Created
: 2025.06.10


![]() 2025.06.10 13:37
2025.06.10 13:37
Gold price (XAU/USD) attracts fresh sellers during the Asian session on Tuesday and drops to the $3,300 neighborhood in the last hour, closer to a one-week low touched the previous day. The optimism over US-China trade talks undermines safe-haven assets, which, along with a goodish pickup in the US Dollar (USD) demand, turn out to be key factors exerting downward pressure on the bullion.
However, the growing acceptance that the Federal Reserve (Fed) will lower borrowing costs further in 2025 might keep a lid on any meaningful USD appreciation. Furthermore, persistent geopolitical risks stemming from the protracted Russia-Ukraine war and conflicts in the Middle East should help limit losses for the Gold price. This warrants caution for the XAU/USD bears ahead of US inflation figures.
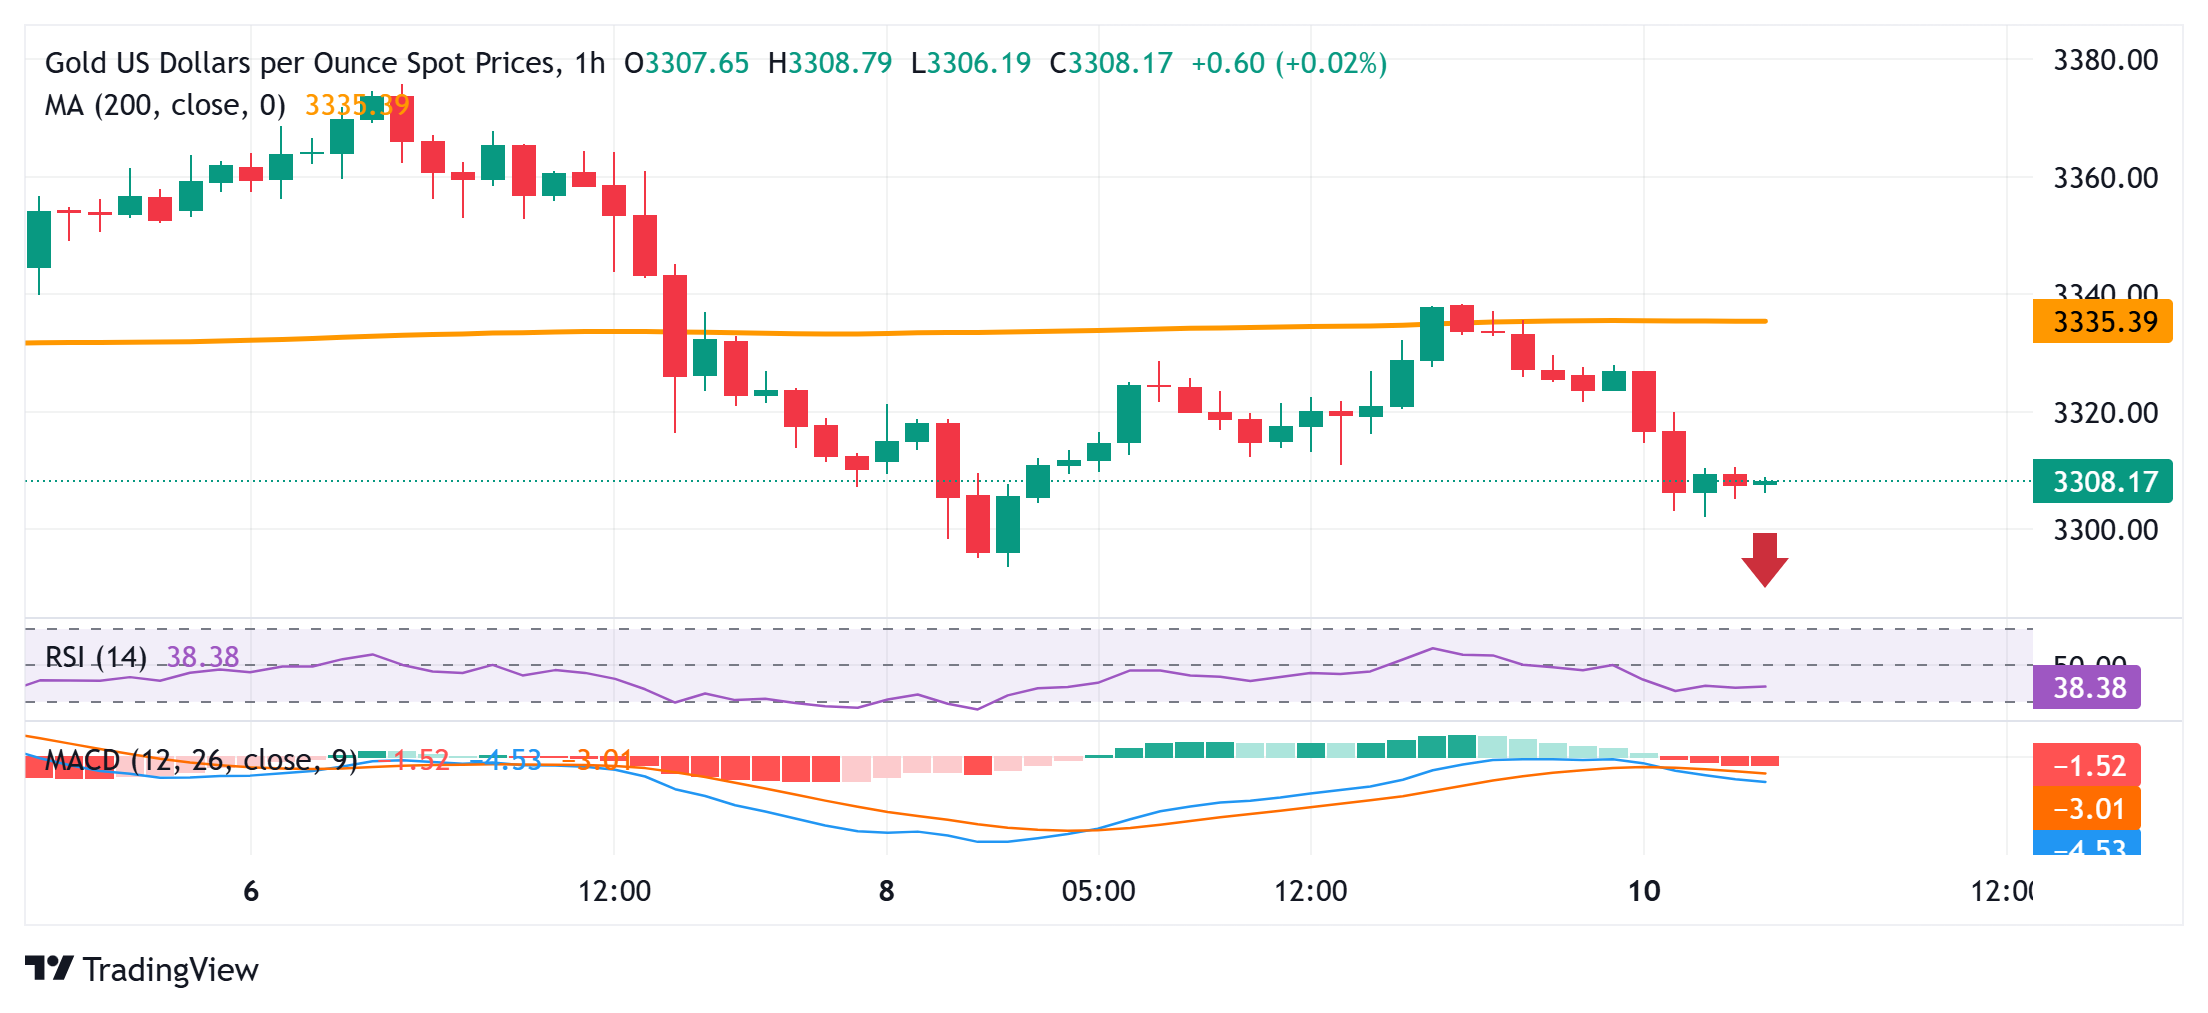
From a technical perspective, the overnight failure to find acceptance above the 200-hour Simple Moving Average (SMA) and the subsequent slide favors the XAU/USD bears. Moreover, oscillators on hourly charts have been gaining negative traction and back the case for further intraday losses. Some follow-through selling below the $3,294-3,293 area, or the overnight swing low, will reaffirm the bearish outlook and make the Gold price vulnerable to accelerate the fall towards the $3,246-3,245 area (May 29 swing low) en route to the $3,200 neighborhood.
On the flip side, the 100-hour SMA, currently pegged near the $3,333-3.334 area might continue to act as an immediate hurdle. A sustained strength beyond could trigger an intraday short-covering move and lift the Gold price to the $3.352-3,353 hurdle. The momentum could extend further towards the $3,377-3,378 resistance, which if cleared should allow the XAU/USD to make a fresh attempt to conquer the $3,400 round figure.
The table below shows the percentage change of US Dollar (USD) against listed major currencies today. US Dollar was the strongest against the Euro.
| USD | EUR | GBP | JPY | CAD | AUD | NZD | CHF | |
|---|---|---|---|---|---|---|---|---|
| USD | 0.26% | 0.12% | 0.25% | 0.04% | -0.08% | -0.03% | 0.12% | |
| EUR | -0.26% | -0.12% | -0.03% | -0.18% | -0.32% | -0.29% | -0.11% | |
| GBP | -0.12% | 0.12% | 0.04% | -0.06% | -0.19% | -0.17% | 0.02% | |
| JPY | -0.25% | 0.03% | -0.04% | -0.16% | -0.35% | -0.35% | -0.19% | |
| CAD | -0.04% | 0.18% | 0.06% | 0.16% | -0.14% | -0.10% | 0.08% | |
| AUD | 0.08% | 0.32% | 0.19% | 0.35% | 0.14% | 0.05% | 0.21% | |
| NZD | 0.03% | 0.29% | 0.17% | 0.35% | 0.10% | -0.05% | 0.19% | |
| CHF | -0.12% | 0.11% | -0.02% | 0.19% | -0.08% | -0.21% | -0.19% |
The heat map shows percentage changes of major currencies against each other. The base currency is picked from the left column, while the quote currency is picked from the top row. For example, if you pick the US Dollar from the left column and move along the horizontal line to the Japanese Yen, the percentage change displayed in the box will represent USD (base)/JPY (quote).
![]()
Created
: 2025.06.10
![]()
Last updated
: 2025.06.10

FXStreet is a forex information website, delivering market analysis and news articles 24/7.
It features a number of articles contributed by well-known analysts, in addition to the ones by its editorial team.
Founded in 2000 by Francesc Riverola, a Spanish economist, it has grown to become a world-renowned information website.
We hope you find this article useful. Any comments or suggestions will be greatly appreciated.
We are also looking for writers with extensive experience in forex and crypto to join us.
please contact us at [email protected].
Disclaimer:![]()
All information and content provided on this website is provided for informational purposes only and is not intended to solicit any investment. Although all efforts are made in order to ensure that the information is correct, no guarantee is provided for the accuracy of any content on this website. Any decision made shall be the responsibility of the investor and Myforex does not take any responsibility whatsoever regarding the use of any information provided herein.
The content provided on this website belongs to Myforex and, where stated, the relevant licensors. All rights are reserved by Myforex and the relevant licensors, and no content of this website, whether in full or in part, shall be copied or displayed elsewhere without the explicit written permission of the relevant copyright holder. If you wish to use any part of the content provided on this website, please ensure that you contact Myforex.
Myforex uses cookies to improve the convenience and functionality of this website. This website may include cookies not only by us but also by third parties (advertisers, log analysts, etc.) for the purpose of tracking the activities of users. Cookie policy
