Created
: 2025.05.20


![]() 2025.05.20 01:28
2025.05.20 01:28
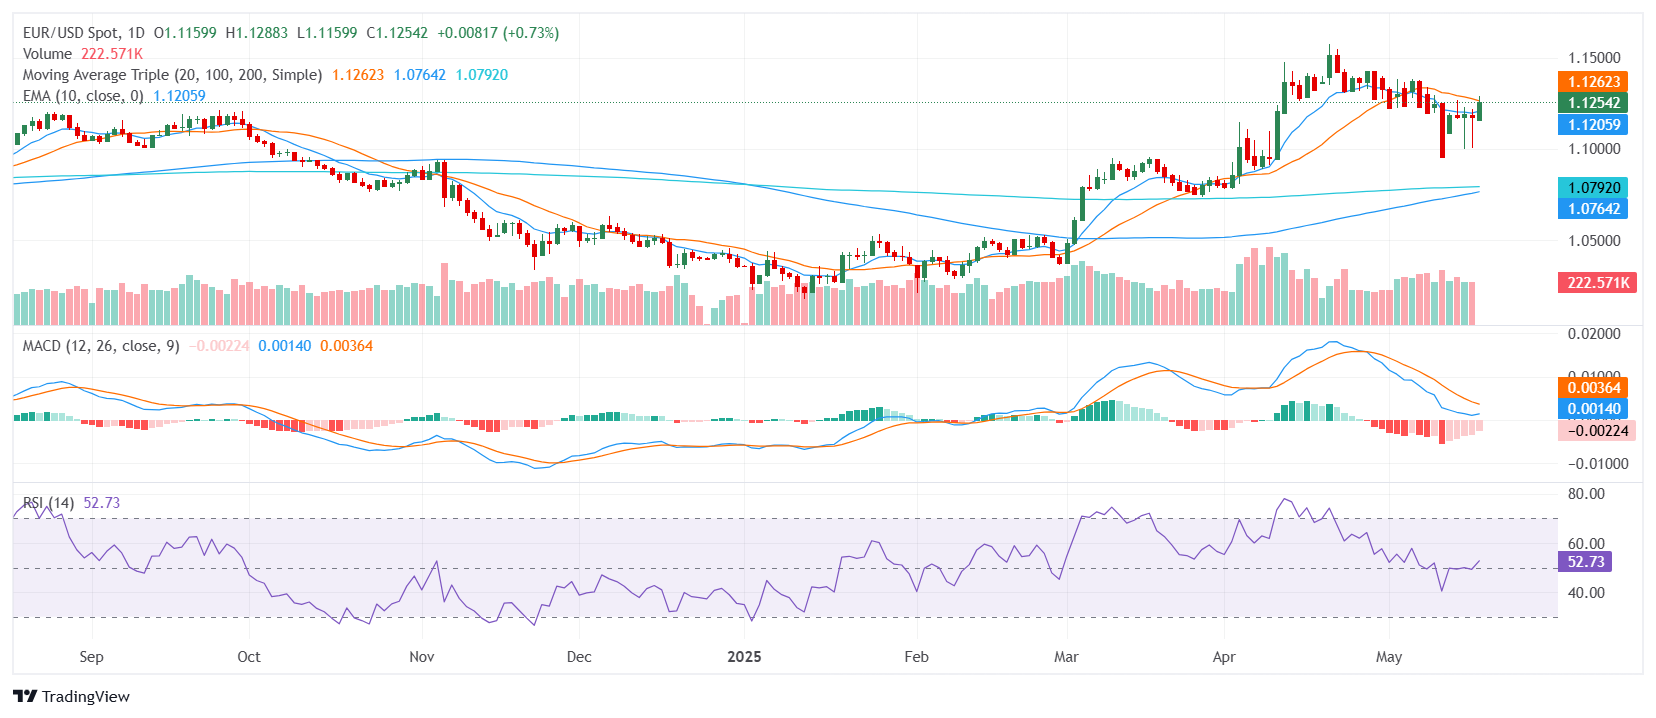
The EUR/USD pair is trading near the 1.13 zone on Monday, reflecting a strong intraday recovery as the market gains momentum after the European session. Despite the sharp upside move, the broader technical outlook presents a mixed picture, with conflicting signals across different timeframes. Shorter-term indicators suggest potential pullbacks, while the longer-term trend remains firmly bullish, providing a cautiously optimistic backdrop for the pair.
The daily technical setup reflects a complex, but overall positive, outlook. The Relative Strength Index (RSI) is in the 50s, signaling neutral momentum, while the Moving Average Convergence Divergence (MACD) still points to sell pressure, highlighting the potential for near-term consolidation. However, the Average Directional Index (14) in the 20s supports buying pressure, suggesting the pair might sustain its recent gains. The Williams Percent Range (14) and the Commodity Channel Index (20) also indicate neutral momentum, reinforcing the cautious tone.
Moving averages paint a more supportive long-term picture. The 10-day Exponential Moving Average (EMA) and the 10-day Simple Moving Average (SMA) are aligned with the current bullish sentiment, while the 100-day and 200-day SMAs confirm the broader upward bias. In contrast, the 20-day SMA remains in sell territory, acting as a potential headwind for the pair's recovery.
Shifting to the 4-hour timeframe, the outlook remains firmly bullish. The 4-hour MACD signals buy momentum, aligning with the broader daily trend, while the shorter-term 10 and 20-period EMAs and SMAs also indicate sustained buying interest. The Relative Strength Index (RSI) and Average Directional Index (ADI) on the 4-hour chart remain neutral, reflecting the current consolidation phase after the sharp move higher.
Immediate support is seen around 1.1230, with additional levels at 1.1220 and 1.1217. On the upside, resistance is likely to emerge around 1.1280, followed closely by 1.1282 and 1.1284. Broader Fibonacci levels place deeper support in the 1.0400 to 1.0900 range, while resistance extends toward 1.1500, 1.1700, and 1.2000, providing a wider context for potential breakout scenarios.
![]()
Created
: 2025.05.20
![]()
Last updated
: 2025.05.20

FXStreet is a forex information website, delivering market analysis and news articles 24/7.
It features a number of articles contributed by well-known analysts, in addition to the ones by its editorial team.
Founded in 2000 by Francesc Riverola, a Spanish economist, it has grown to become a world-renowned information website.
We hope you find this article useful. Any comments or suggestions will be greatly appreciated.
We are also looking for writers with extensive experience in forex and crypto to join us.
please contact us at [email protected].
Disclaimer:![]()
All information and content provided on this website is provided for informational purposes only and is not intended to solicit any investment. Although all efforts are made in order to ensure that the information is correct, no guarantee is provided for the accuracy of any content on this website. Any decision made shall be the responsibility of the investor and Myforex does not take any responsibility whatsoever regarding the use of any information provided herein.
The content provided on this website belongs to Myforex and, where stated, the relevant licensors. All rights are reserved by Myforex and the relevant licensors, and no content of this website, whether in full or in part, shall be copied or displayed elsewhere without the explicit written permission of the relevant copyright holder. If you wish to use any part of the content provided on this website, please ensure that you contact Myforex.
Myforex uses cookies to improve the convenience and functionality of this website. This website may include cookies not only by us but also by third parties (advertisers, log analysts, etc.) for the purpose of tracking the activities of users. Cookie policy
