Created
: 2025.05.17


![]() 2025.05.17 00:47
2025.05.17 00:47
The US Dollar (USD) is trading higher against the safe-haven Swiss Franc (CHF) on Friday, as markets continue to digest the ongoing developments in tariff negotiations, interest rate expectations, and broader risk sentiment. At the time of writing, USD/CHF is testing a critical layer of resistance at 0.838, posting a modest 0.28% gain on the day.
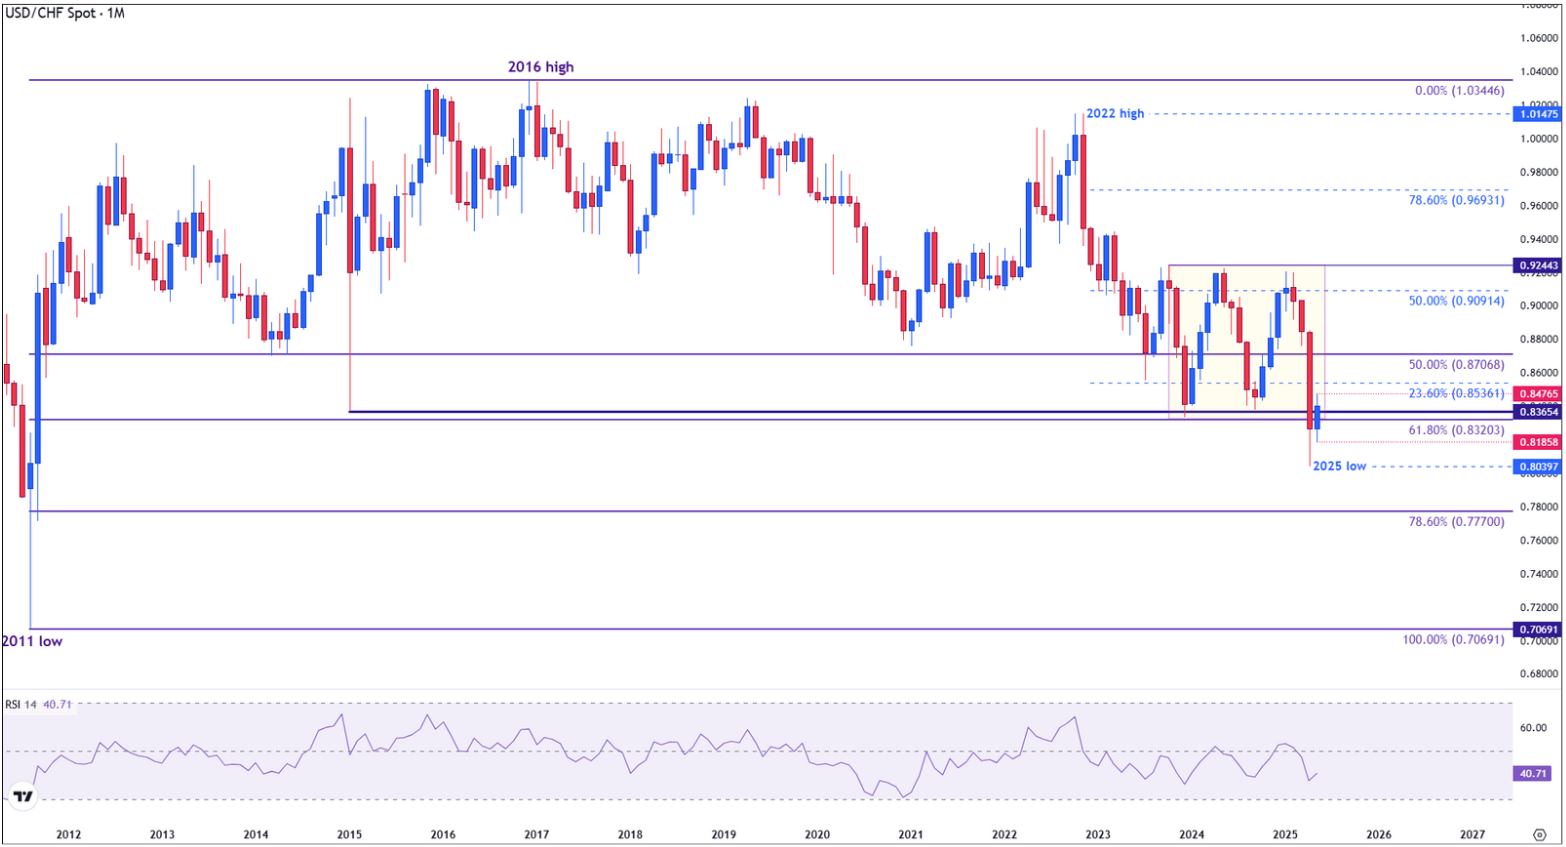
USD/CHF found strong support on April 21 near 0.8040 -- its lowest level since 2015 -- and has since begun to recover. This bounce came just below a key long-term Fibonacci retracement level near 0.8320, which has historically acted as a major turning point for the pair. Notably, this same zone helped stabilize prices during the 2015-2016 consolidation, adding weight to its importance as a structural base.
The current rebound is approaching a key resistance zone around 0.8540. This level is important for several reasons: it marks the 23.6% Fibonacci retracement of the downtrend from the 2022 peak, it coincides with an old multi-year support from 2015 that broke earlier this year, and it aligns with the bottom of a trading range that held from mid-2023 to early 2025.
A monthly close above this area would indicate a deeper shift in market sentiment, potentially confirming a trend reversal. However, if price fails to break through, the broader downtrend remains in play, with renewed risk of a move back toward 0.7770 or even the long-term cycle low near 0.7070.
USD/CHF monthly chart
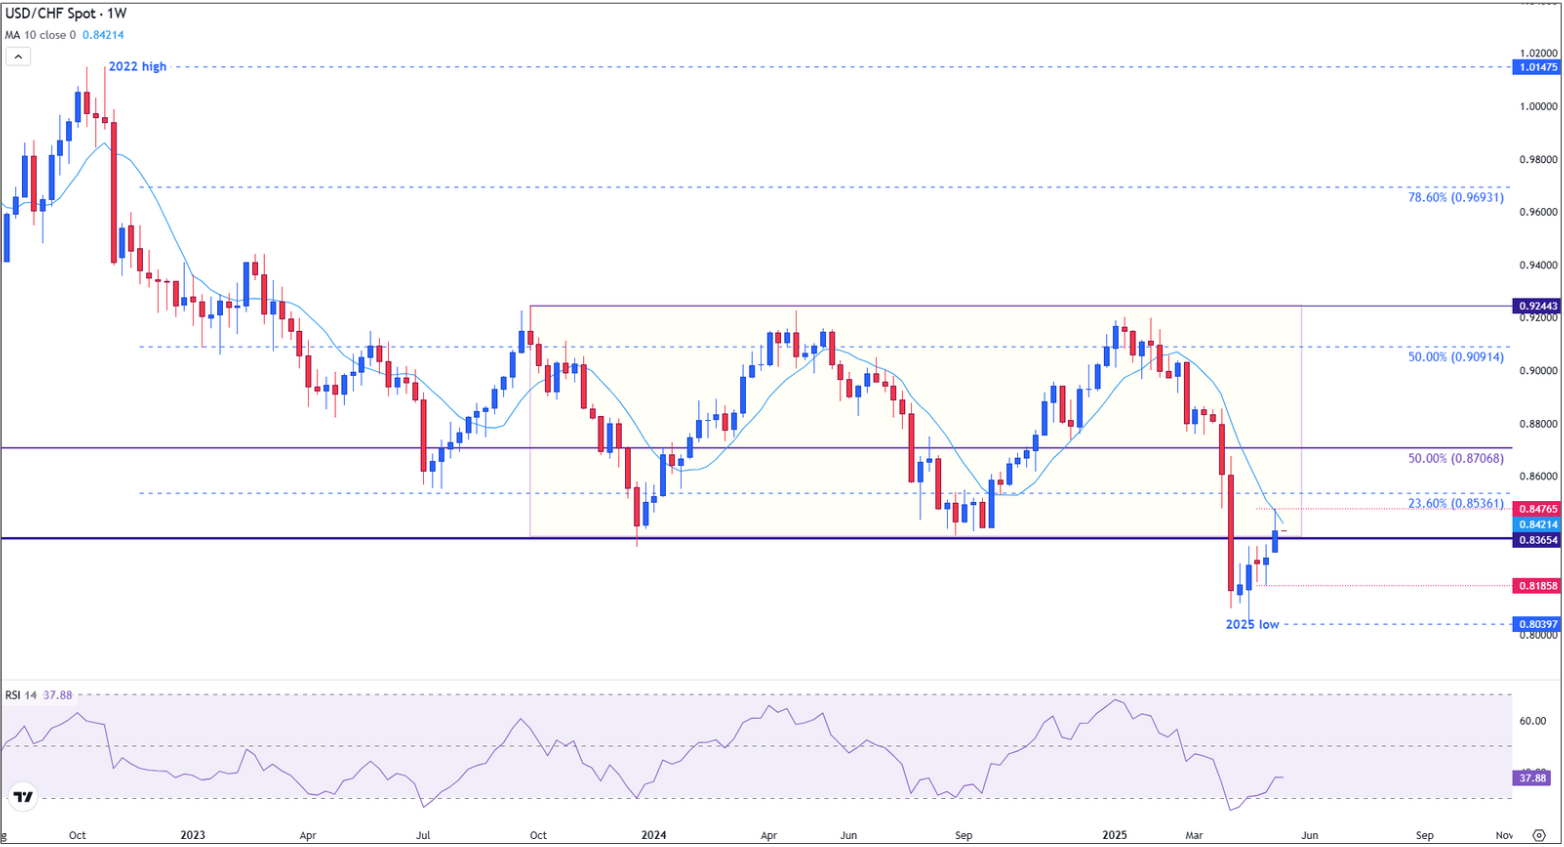
On the weekly time frame, USD/CHF has posted three consecutive bullish candles, reflecting a recovery from oversold conditions. The pair is testing the 10-week Simple Moving Average (SMA) near 0.8419, which has acted as dynamic resistance since March. The broader 0.8419-0.8536 zone is technically dense, representing a former support region from 2023 that failed earlier this year.
The Relative Strength Index (RSI) has recovered to around 37.2, indicating easing bearish momentum. However, it remains well below the neutral 50 level, underscoring the tentative nature of the current rebound.
A confirmed weekly close above 0.8536 would represent a meaningful break in structure, opening upside potential toward the mid-point of the 2022-2025 decline at 0.8706.
USD/CHF weekly chart
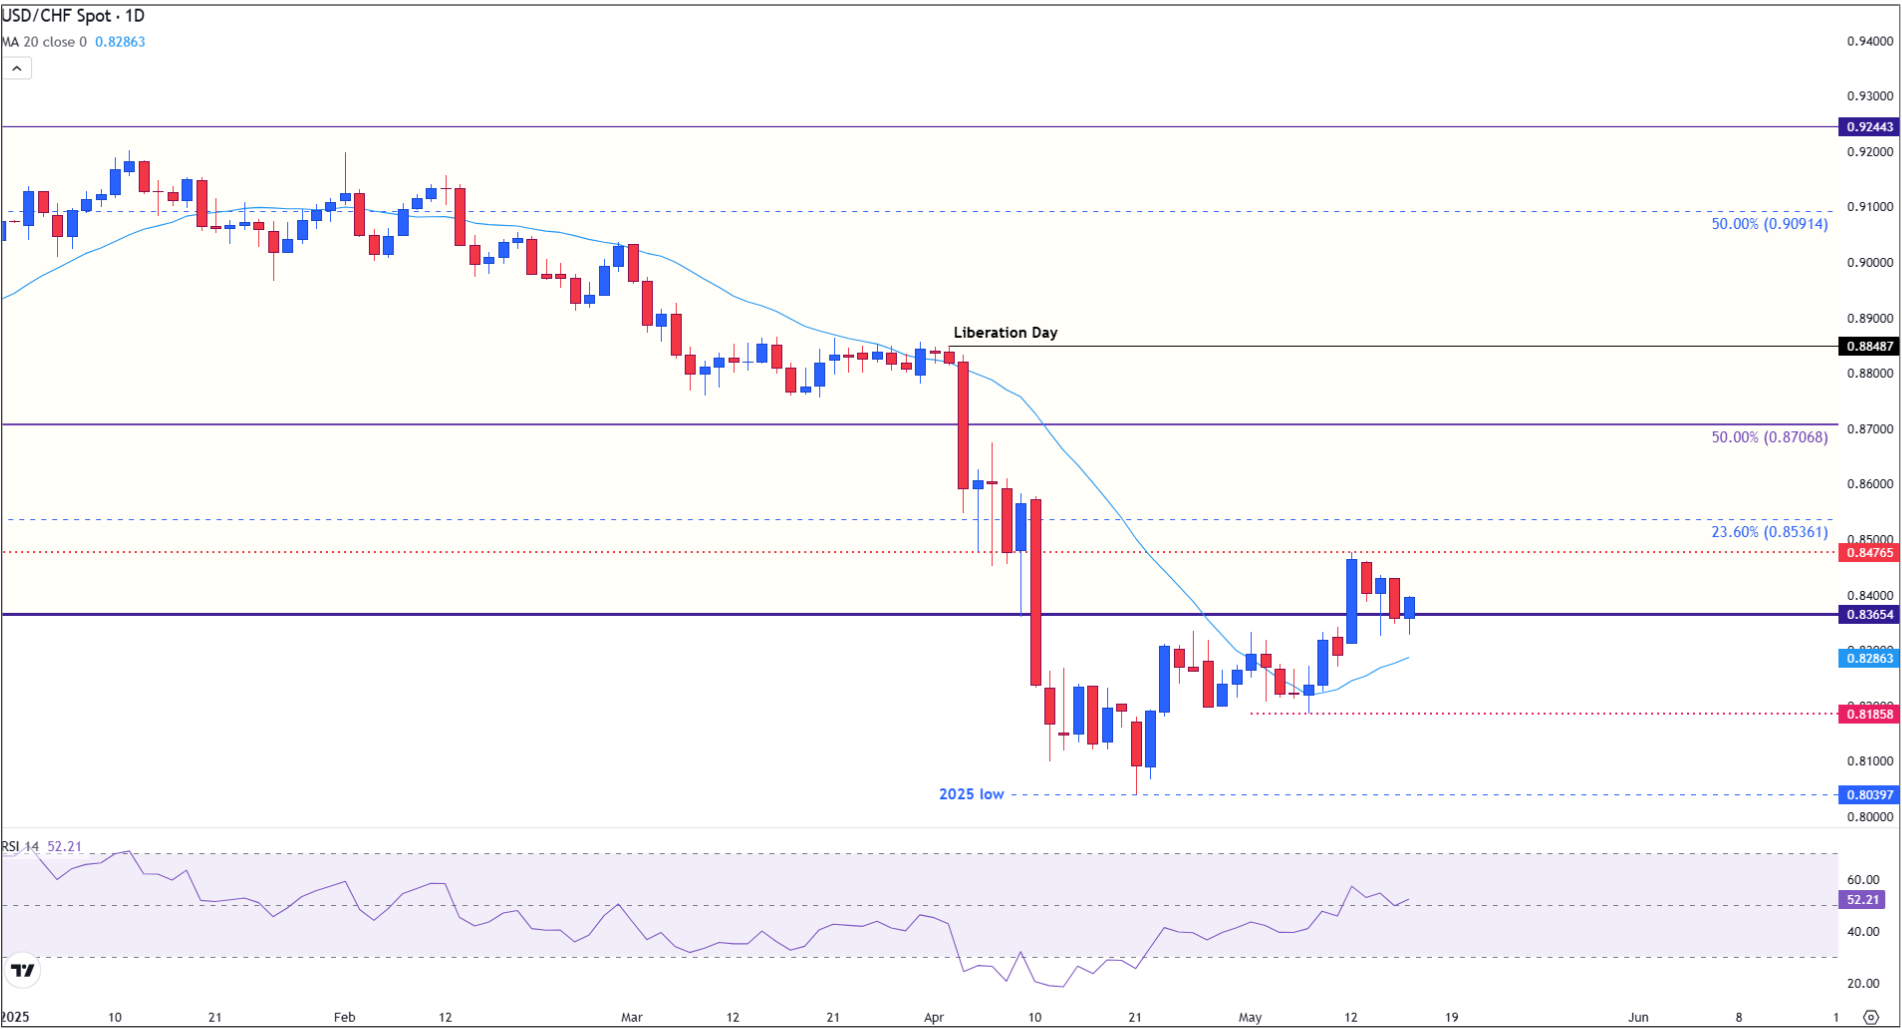
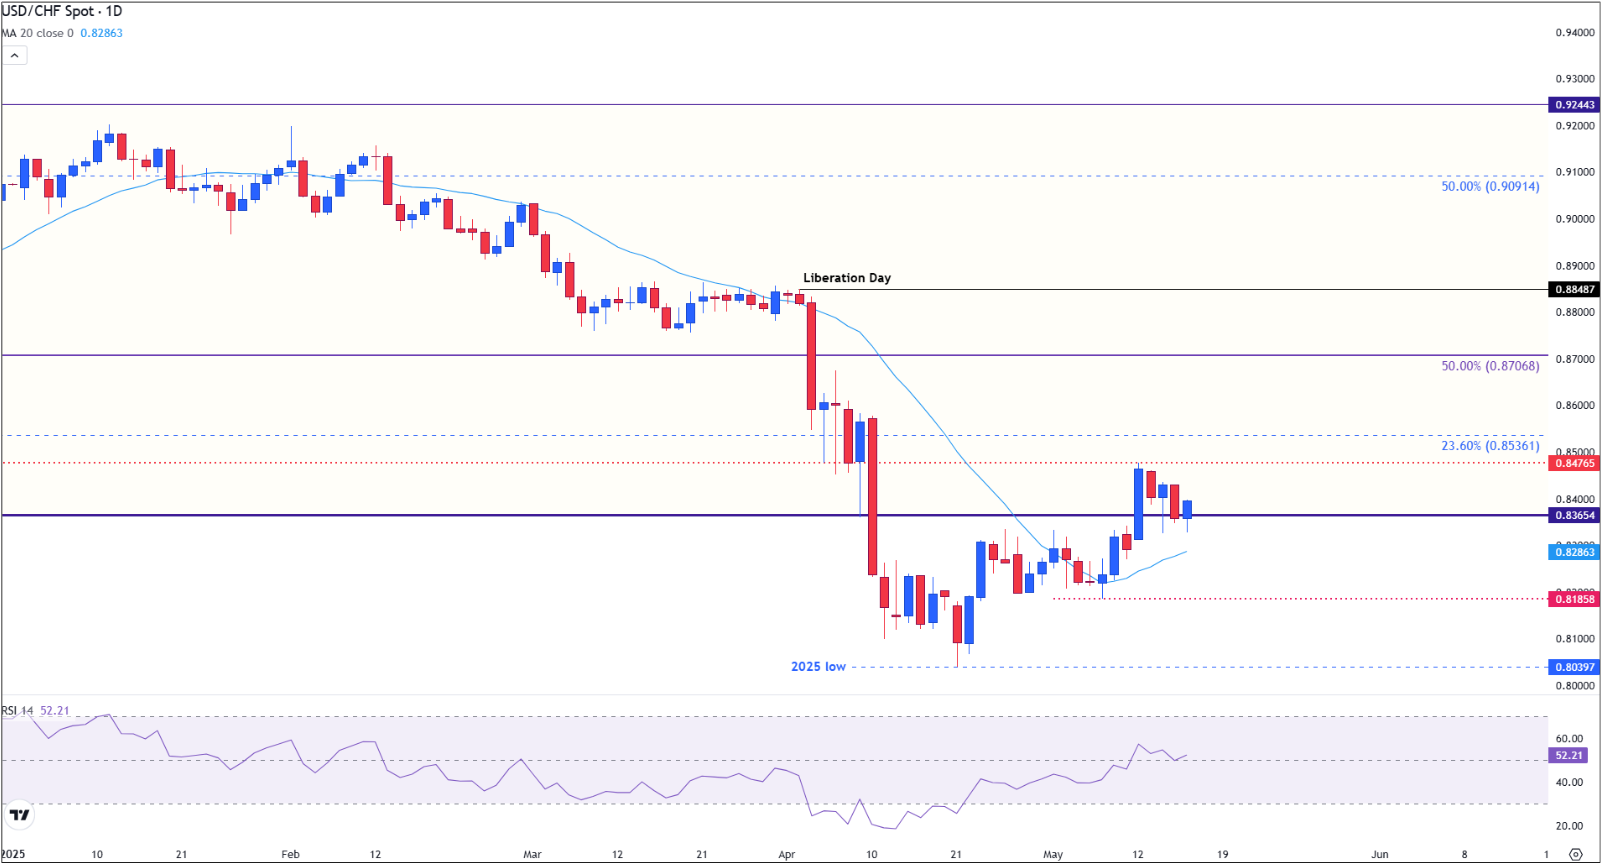
The daily chart shows that USD/CHF is consolidating just below the 0.8536 barrier after rallying from the April low at 0.8039. Price action remains supported by a rising 20-day SMA, currently at 0.8285, while a pattern of higher lows signals ongoing demand. Still, momentum is waning, with the Relative Strength Index (RSI) stabilizing near 51.2 - a neutral reading that reflects a balanced, but indecisive, market.
Without a breakout above 0.8536, the risk of a corrective pullback is growing. Immediate support is found at 0.8320, the long-term Fibonacci zone, followed by 0.8185. A confirmed daily close above 0.8536 would likely trigger follow-through buying and bring 0.8706 into view.
USD/CHF daily chart
The table below shows the percentage change of US Dollar (USD) against listed major currencies today. US Dollar was the strongest against the Swiss Franc.
| USD | EUR | GBP | JPY | CAD | AUD | NZD | CHF | |
|---|---|---|---|---|---|---|---|---|
| USD | 0.34% | 0.31% | 0.20% | 0.19% | 0.23% | 0.12% | 0.43% | |
| EUR | -0.34% | -0.02% | -0.13% | -0.16% | -0.11% | -0.22% | 0.09% | |
| GBP | -0.31% | 0.02% | -0.10% | -0.13% | -0.09% | -0.19% | 0.11% | |
| JPY | -0.20% | 0.13% | 0.10% | -0.02% | -0.01% | -0.12% | 0.20% | |
| CAD | -0.19% | 0.16% | 0.13% | 0.02% | 0.02% | -0.06% | 0.25% | |
| AUD | -0.23% | 0.11% | 0.09% | 0.00% | -0.02% | -0.09% | 0.21% | |
| NZD | -0.12% | 0.22% | 0.19% | 0.12% | 0.06% | 0.09% | 0.30% | |
| CHF | -0.43% | -0.09% | -0.11% | -0.20% | -0.25% | -0.21% | -0.30% |
The heat map shows percentage changes of major currencies against each other. The base currency is picked from the left column, while the quote currency is picked from the top row. For example, if you pick the US Dollar from the left column and move along the horizontal line to the Japanese Yen, the percentage change displayed in the box will represent USD (base)/JPY (quote).
![]()
Created
: 2025.05.17
![]()
Last updated
: 2025.05.17

FXStreet is a forex information website, delivering market analysis and news articles 24/7.
It features a number of articles contributed by well-known analysts, in addition to the ones by its editorial team.
Founded in 2000 by Francesc Riverola, a Spanish economist, it has grown to become a world-renowned information website.
We hope you find this article useful. Any comments or suggestions will be greatly appreciated.
We are also looking for writers with extensive experience in forex and crypto to join us.
please contact us at [email protected].
Disclaimer:![]()
All information and content provided on this website is provided for informational purposes only and is not intended to solicit any investment. Although all efforts are made in order to ensure that the information is correct, no guarantee is provided for the accuracy of any content on this website. Any decision made shall be the responsibility of the investor and Myforex does not take any responsibility whatsoever regarding the use of any information provided herein.
The content provided on this website belongs to Myforex and, where stated, the relevant licensors. All rights are reserved by Myforex and the relevant licensors, and no content of this website, whether in full or in part, shall be copied or displayed elsewhere without the explicit written permission of the relevant copyright holder. If you wish to use any part of the content provided on this website, please ensure that you contact Myforex.
Myforex uses cookies to improve the convenience and functionality of this website. This website may include cookies not only by us but also by third parties (advertisers, log analysts, etc.) for the purpose of tracking the activities of users. Cookie policy
