Created
: 2025.05.13


![]() 2025.05.13 23:35
2025.05.13 23:35
Silver (XAG/USD) is hovering above the 50-day Exponential Moving Average (EMA) near $32.50 at the time of writing on Tuesday. However, the white metal experienced notable volatility, initially rallying close to 2% during the Asian session. Still, the rally lost steam ahead of the US Consumer Price Index (CPI) release, with XAG/USD retreating and paring all intraday gains as traders grew cautious. The metal has since found some stability following a weaker-than-expected inflation print, reviving hopes for an interest rate cut by the Federal Reserve (Fed) in the coming months.
According to the US Bureau of Labor Statistics, headline CPI eased to 2.3% year-over-year in April - its lowest reading since February 2021 and slightly below the 2.4% market forecast. On a month-over-month basis, CPI rose 0.2%, recovering from a 0.1% contraction in March but still under the projected 0.3% increase. Meanwhile, core inflation held steady at 2.8% annually, staying at a four-year low.
The softer inflation print will reduce pressure on the Fed to keep interest rates elevated and could revive hopes of rate cuts, improving sentiment toward non-yielding assets like silver.
Adding to the tailwinds, markets are also digesting the implications of a 90-day tariff rollback between the US and China. Under the agreement, both countries agreed to reduce tariffs to 30% and 10%, respectively, providing a temporary lift to risk appetite. US Treasury Secretary Scott Bessent confirmed plans to meet with Chinese counterparts in the coming weeks to explore the framework for a broader trade agreement.
Technical analysis: Silver consolidates below key resistance as symmetrical triangle tightens
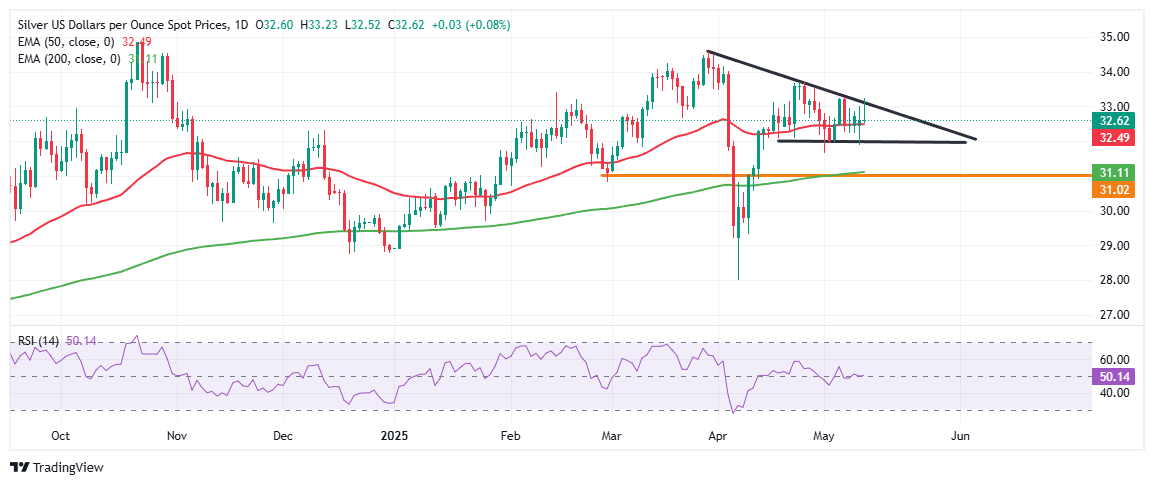
XAG/USD is holding near $32.50 in Tuesday's session, consolidating beneath a key descending trendline resistance around the $33.00 mark. The price action is compressing into the apex of a symmetrical triangle on the daily chart, signaling a potential breakout in either direction.
The 50-day Exponential Moving Average (EMA) stands at $32.50, a level that has consistently acted as strong dynamic support in recent sessions. The next downside support lies at the $32.00 psychological level. A firm break below this zone could trigger deeper losses toward the $31.00 psychological region, which aligns with the 200-day EMA at $31.11 - last visited in mid-April.
On the momentum side, the Relative Strength Index (RSI) on the daily chart is flat at 50.14, signaling indecision and a lack of momentum in either direction. Broadly, the pair remains locked within a symmetrical triangle pattern, suggesting traders are awaiting a fundamental catalyst to trigger the next breakout. A decisive move above the descending trendline near $33.00 could fuel bullish momentum toward $34.00 and eventually $35.00.
However, failure to break above resistance and a drop below $31.00 would negate the bullish bias and invite fresh selling pressure.
![]()
Created
: 2025.05.13
![]()
Last updated
: 2025.05.13

FXStreet is a forex information website, delivering market analysis and news articles 24/7.
It features a number of articles contributed by well-known analysts, in addition to the ones by its editorial team.
Founded in 2000 by Francesc Riverola, a Spanish economist, it has grown to become a world-renowned information website.
We hope you find this article useful. Any comments or suggestions will be greatly appreciated.
We are also looking for writers with extensive experience in forex and crypto to join us.
please contact us at [email protected].
Disclaimer:![]()
All information and content provided on this website is provided for informational purposes only and is not intended to solicit any investment. Although all efforts are made in order to ensure that the information is correct, no guarantee is provided for the accuracy of any content on this website. Any decision made shall be the responsibility of the investor and Myforex does not take any responsibility whatsoever regarding the use of any information provided herein.
The content provided on this website belongs to Myforex and, where stated, the relevant licensors. All rights are reserved by Myforex and the relevant licensors, and no content of this website, whether in full or in part, shall be copied or displayed elsewhere without the explicit written permission of the relevant copyright holder. If you wish to use any part of the content provided on this website, please ensure that you contact Myforex.
Myforex uses cookies to improve the convenience and functionality of this website. This website may include cookies not only by us but also by third parties (advertisers, log analysts, etc.) for the purpose of tracking the activities of users. Cookie policy
