Created
: 2025.05.05


![]() 2025.05.05 20:18
2025.05.05 20:18
The US Dollar Index (DXY), which tracks the performance of the US Dollar (USD) against six major currencies, edges lower and remains capped below the 100.00 level at the time of writing on Monday after the Taiwan Dollar (TWD) surges over 5% and triggers a spillover effect in Asian currencies against the Greenback. It is the biggest intraday gain in over three decades, on speculation that exporters are rushing to convert their holdings of US Dollars to the island's currency, according to Bloomberg. All this occurs in a very illiquid market with several Asian countries, such as China, and the United Kingdom, closed for a public holiday.
The move opens up an interesting element in the tariff talks that are taking place between the United States (US) and Taiwan. One of the reasons exporters are buying Taiwan Dollars is that they expect the authorities will allow the currency to appreciate to help reach a trade deal with the US. Taiwan's government said Saturday its negotiation team had conducted the first round of meetings with the US on May 1, though no details were released.
The US Dollar Index (DXY) is moving due to a bunch of spillover and domino effects from the Taiwan Dollar. Although it is not part of the Index, other currencies in the Asian region follow, with the Japanese Yen (JPY), which accounts for 13.6% of the DXY, currently trading nearly 1% stronger against the Greenback. A side effect of the demands from the Trump administration, urging exporting countries to appreciate their currency as one of the demands to avoid tariffs, hits. In turn, this revaluation weakens the Greenback, and this was only Taiwan.
On the upside, the DXY's first resistance comes in at 100.22, which supported the DXY back in September 2024, with a break back above the 100.00 round level as a bullish signal. A firm recovery would be a return to 101.90, which acted as a pivotal level throughout December 2023 and again as a base for the inverted head-and-shoulders (H&S) formation during the summer of 2024.
On the other hand, the 97.73 support could quickly be tested on any substantial bearish headline. Further below, a relatively thin technical support comes in at 96.94 before looking at the lower levels of this new price range. These would be at 95.25 and 94.56, meaning fresh lows not seen since 2022.
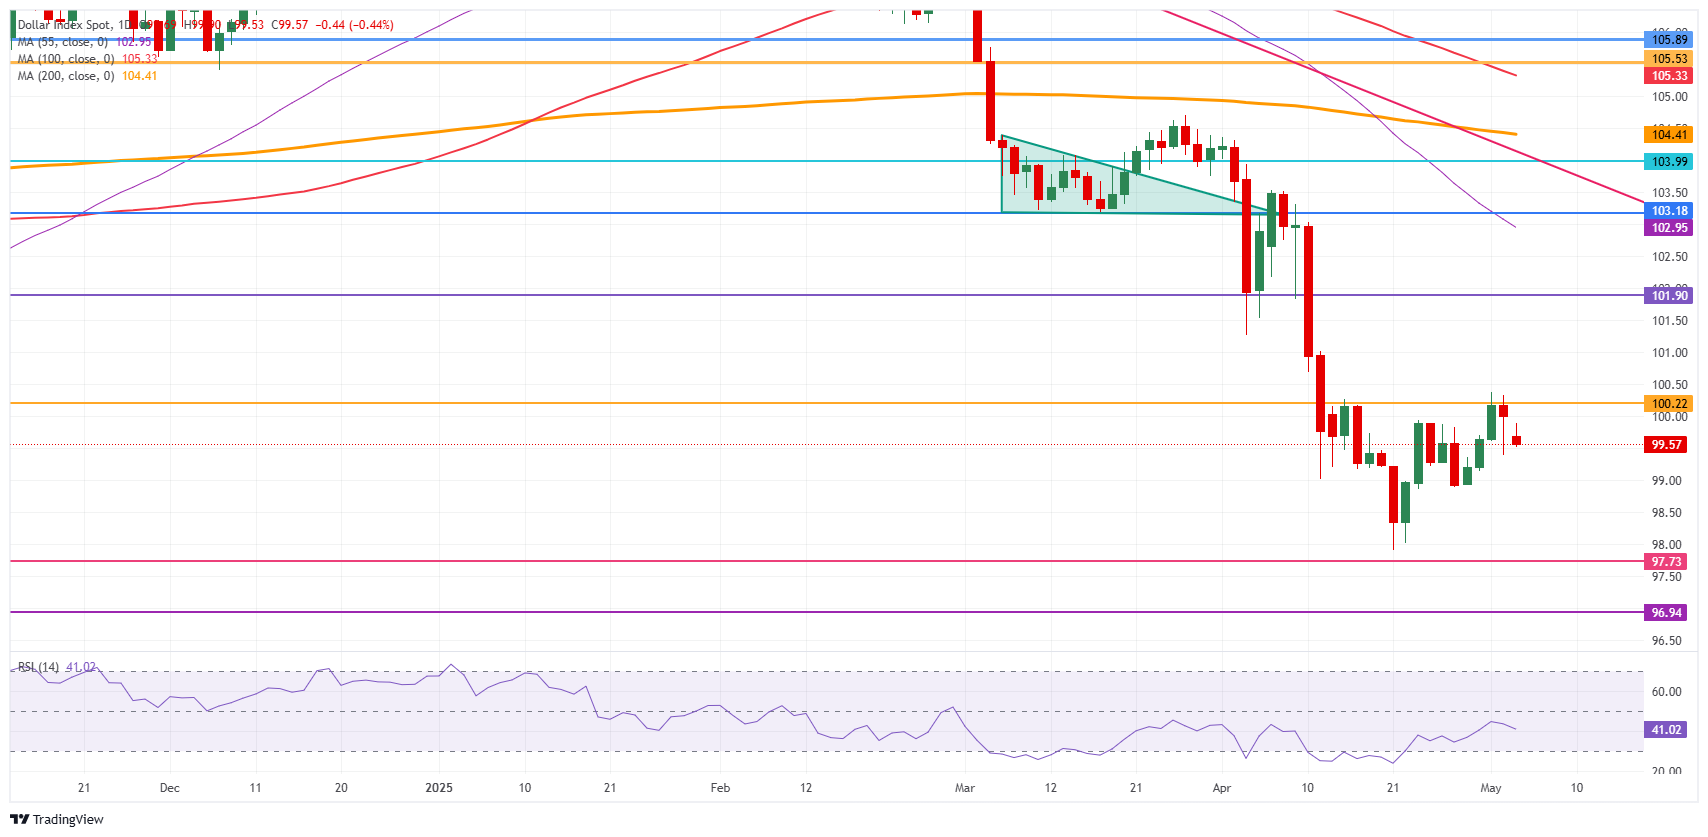
US Dollar Index: Daily Chart
Generally speaking, a trade war is an economic conflict between two or more countries due to extreme protectionism on one end. It implies the creation of trade barriers, such as tariffs, which result in counter-barriers, escalating import costs, and hence the cost of living.
An economic conflict between the United States (US) and China began early in 2018, when President Donald Trump set trade barriers on China, claiming unfair commercial practices and intellectual property theft from the Asian giant. China took retaliatory action, imposing tariffs on multiple US goods, such as automobiles and soybeans. Tensions escalated until the two countries signed the US-China Phase One trade deal in January 2020. The agreement required structural reforms and other changes to China's economic and trade regime and pretended to restore stability and trust between the two nations. However, the Coronavirus pandemic took the focus out of the conflict. Yet, it is worth mentioning that President Joe Biden, who took office after Trump, kept tariffs in place and even added some additional levies.
The return of Donald Trump to the White House as the 47th US President has sparked a fresh wave of tensions between the two countries. During the 2024 election campaign, Trump pledged to impose 60% tariffs on China once he returned to office, which he did on January 20, 2025. With Trump back, the US-China trade war is meant to resume where it was left, with tit-for-tat policies affecting the global economic landscape amid disruptions in global supply chains, resulting in a reduction in spending, particularly investment, and directly feeding into the Consumer Price Index inflation.
![]()
Created
: 2025.05.05
![]()
Last updated
: 2025.05.05

FXStreet is a forex information website, delivering market analysis and news articles 24/7.
It features a number of articles contributed by well-known analysts, in addition to the ones by its editorial team.
Founded in 2000 by Francesc Riverola, a Spanish economist, it has grown to become a world-renowned information website.
We hope you find this article useful. Any comments or suggestions will be greatly appreciated.
We are also looking for writers with extensive experience in forex and crypto to join us.
please contact us at [email protected].
Disclaimer:![]()
All information and content provided on this website is provided for informational purposes only and is not intended to solicit any investment. Although all efforts are made in order to ensure that the information is correct, no guarantee is provided for the accuracy of any content on this website. Any decision made shall be the responsibility of the investor and Myforex does not take any responsibility whatsoever regarding the use of any information provided herein.
The content provided on this website belongs to Myforex and, where stated, the relevant licensors. All rights are reserved by Myforex and the relevant licensors, and no content of this website, whether in full or in part, shall be copied or displayed elsewhere without the explicit written permission of the relevant copyright holder. If you wish to use any part of the content provided on this website, please ensure that you contact Myforex.
Myforex uses cookies to improve the convenience and functionality of this website. This website may include cookies not only by us but also by third parties (advertisers, log analysts, etc.) for the purpose of tracking the activities of users. Cookie policy
