Created
: 2025.05.02


![]() 2025.05.02 00:09
2025.05.02 00:09
Silver price (XAG/USD) recovers a majority of its early gains and returns to near $32.50 during North American trading hours on Thursday. The white metal gained ground after posting a fresh over two-week low around $31.66, earlier in the day, even though the US Dollar (USD) has extended its two-day recovery.
The table below shows the percentage change of US Dollar (USD) against listed major currencies today. US Dollar was the strongest against the Japanese Yen.
| USD | EUR | GBP | JPY | CAD | AUD | NZD | CHF | |
|---|---|---|---|---|---|---|---|---|
| USD | 0.37% | 0.25% | 1.54% | 0.23% | 0.21% | 0.35% | 0.72% | |
| EUR | -0.37% | -0.12% | 1.13% | -0.17% | -0.14% | -0.02% | 0.33% | |
| GBP | -0.25% | 0.12% | 1.26% | -0.02% | -0.03% | 0.10% | 0.46% | |
| JPY | -1.54% | -1.13% | -1.26% | -1.30% | -1.29% | -1.22% | -0.87% | |
| CAD | -0.23% | 0.17% | 0.02% | 1.30% | 0.00% | 0.12% | 0.48% | |
| AUD | -0.21% | 0.14% | 0.03% | 1.29% | -0.00% | 0.12% | 0.50% | |
| NZD | -0.35% | 0.02% | -0.10% | 1.22% | -0.12% | -0.12% | 0.36% | |
| CHF | -0.72% | -0.33% | -0.46% | 0.87% | -0.48% | -0.50% | -0.36% |
The heat map shows percentage changes of major currencies against each other. The base currency is picked from the left column, while the quote currency is picked from the top row. For example, if you pick the US Dollar from the left column and move along the horizontal line to the Japanese Yen, the percentage change displayed in the box will represent USD (base)/JPY (quote).
Technically, higher US Dollar makes the Silver price an expensive bet for investors.
The US Dollar Index (DXY), which tracks the Greenback's value against six major currencies, jumps above 100.00. The Greenback strengthens even though the United States (US) ISM Manufacturing PMI data for April has shown that activities declined at a faster pace. The Manufacturing PMI is down at 48.7 from 49.0 in March but higher than estimates of 48.0.
Meanwhile, ISM Manufacturing Prices Paid, which gauges change in input cost, expanded at a faster pace to 69.8 from 69.4, but missed estimates of 70.3. Accelerating input costs are expected to feed consumer inflation. Such a scenario will limit the Federal Reserve (Fed) from reducing interest rates, which bodes poorly for non-yielding assets, such as Silver.
Earlier in the day, the Silver price fell sharply as investors expect that fears of additional tariffs announced by US President Donald Trump have peaked as Washinton is close to announce bilateral trades with number of its trading partners soon.
"Initial trade deals are to be announced in weeks, not months," US Trade Representative Jamieson Greer said at Fox News, Reuters reported.
However, trade uncertainty between the US and China will keep the downside in the Silver price limited.
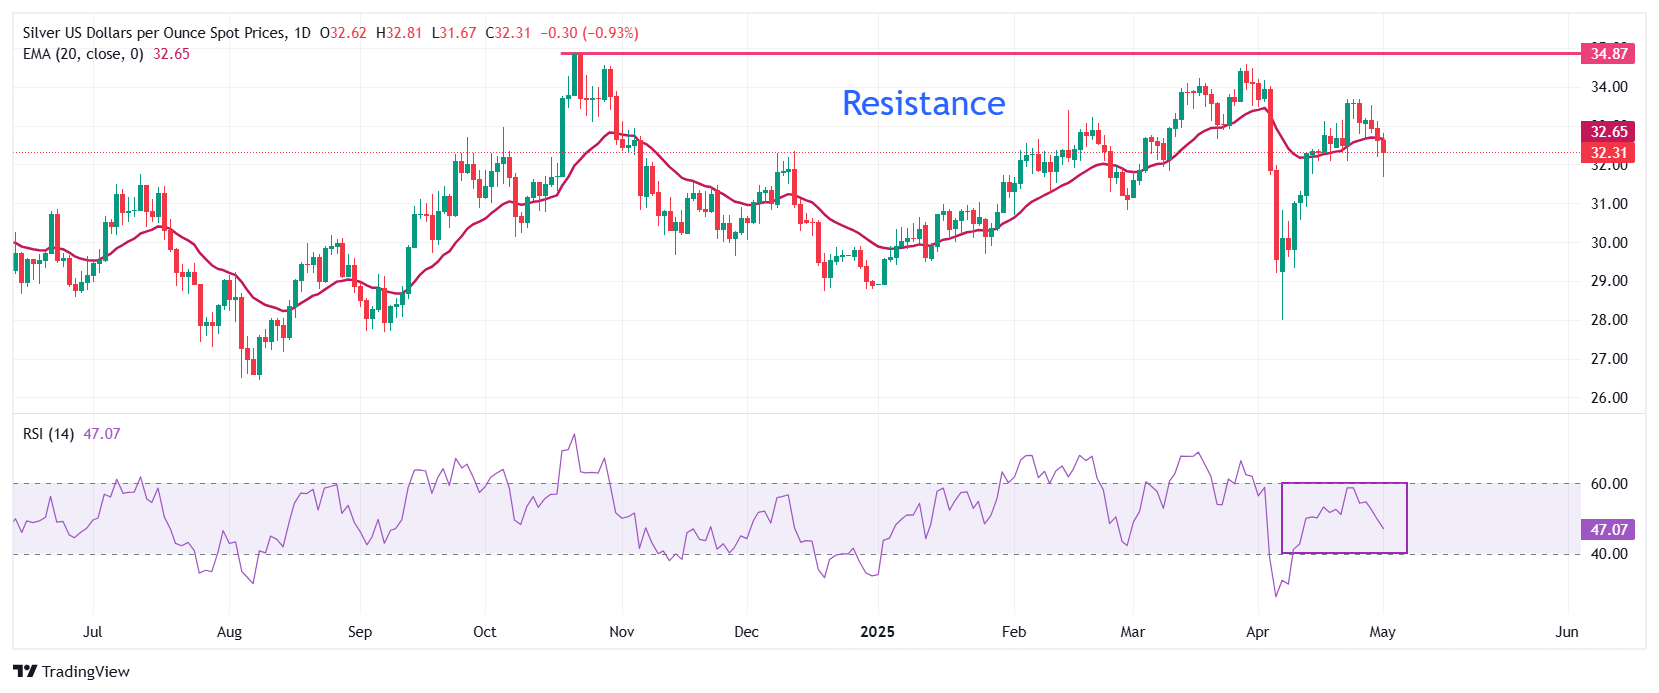
Silver price struggles to revisit an over three-week high around $33.70. The near-term outlook of the white metal has become uncertain as it falls below the 20-day Exponential Moving Average (EMA), which trades around $32.65.
The 14-day Relative Strength Index (RSI) falls below 50.00 after failing to break above 60.00, indicating that investors are not bullish anymore.
Looking up, the March 28 high of $34.60 will act as key resistance for the metal. On the downside, the April 11 low of $30.90 will be the key support zone.
Silver is a precious metal highly traded among investors. It has been historically used as a store of value and a medium of exchange. Although less popular than Gold, traders may turn to Silver to diversify their investment portfolio, for its intrinsic value or as a potential hedge during high-inflation periods. Investors can buy physical Silver, in coins or in bars, or trade it through vehicles such as Exchange Traded Funds, which track its price on international markets.
Silver prices can move due to a wide range of factors. Geopolitical instability or fears of a deep recession can make Silver price escalate due to its safe-haven status, although to a lesser extent than Gold's. As a yieldless asset, Silver tends to rise with lower interest rates. Its moves also depend on how the US Dollar (USD) behaves as the asset is priced in dollars (XAG/USD). A strong Dollar tends to keep the price of Silver at bay, whereas a weaker Dollar is likely to propel prices up. Other factors such as investment demand, mining supply - Silver is much more abundant than Gold - and recycling rates can also affect prices.
Silver is widely used in industry, particularly in sectors such as electronics or solar energy, as it has one of the highest electric conductivity of all metals - more than Copper and Gold. A surge in demand can increase prices, while a decline tends to lower them. Dynamics in the US, Chinese and Indian economies can also contribute to price swings: for the US and particularly China, their big industrial sectors use Silver in various processes; in India, consumers' demand for the precious metal for jewellery also plays a key role in setting prices.
Silver prices tend to follow Gold's moves. When Gold prices rise, Silver typically follows suit, as their status as safe-haven assets is similar. The Gold/Silver ratio, which shows the number of ounces of Silver needed to equal the value of one ounce of Gold, may help to determine the relative valuation between both metals. Some investors may consider a high ratio as an indicator that Silver is undervalued, or Gold is overvalued. On the contrary, a low ratio might suggest that Gold is undervalued relative to Silver.
![]()
Created
: 2025.05.02
![]()
Last updated
: 2025.05.02

FXStreet is a forex information website, delivering market analysis and news articles 24/7.
It features a number of articles contributed by well-known analysts, in addition to the ones by its editorial team.
Founded in 2000 by Francesc Riverola, a Spanish economist, it has grown to become a world-renowned information website.
We hope you find this article useful. Any comments or suggestions will be greatly appreciated.
We are also looking for writers with extensive experience in forex and crypto to join us.
please contact us at [email protected].
Disclaimer:![]()
All information and content provided on this website is provided for informational purposes only and is not intended to solicit any investment. Although all efforts are made in order to ensure that the information is correct, no guarantee is provided for the accuracy of any content on this website. Any decision made shall be the responsibility of the investor and Myforex does not take any responsibility whatsoever regarding the use of any information provided herein.
The content provided on this website belongs to Myforex and, where stated, the relevant licensors. All rights are reserved by Myforex and the relevant licensors, and no content of this website, whether in full or in part, shall be copied or displayed elsewhere without the explicit written permission of the relevant copyright holder. If you wish to use any part of the content provided on this website, please ensure that you contact Myforex.
Myforex uses cookies to improve the convenience and functionality of this website. This website may include cookies not only by us but also by third parties (advertisers, log analysts, etc.) for the purpose of tracking the activities of users. Cookie policy
