Created
: 2025.04.30


![]() 2025.04.30 11:02
2025.04.30 11:02
The Australian Dollar (AUD) is gaining ground on Wednesday following a more than 0.50% decline against the US Dollar (USD) in the previous session. The AUD/USD pair appreciates following the release of key economic data from Australia and China.
The Australian Bureau of Statistics (ABS) reported that the Consumer Price Index (CPI) rose by 0.9% quarter-over-quarter in Q1 2025, up from a 0.2% increase in Q4 2024 and exceeding market expectations of a 0.8% rise. On an annual basis, CPI climbed 2.4% in the first quarter, beating the forecast of 2.2%.
Australia's Monthly CPI held steady with a 2.4% year-over-year increase in March. Meanwhile, the Reserve Bank of Australia's (RBA) Trimmed Mean CPI rose 2.9% year-over-year in Q1, in line with expectations, while the quarterly figure also met forecasts at 0.7%.
In China, the National Bureau of Statistics (NBS) reported that the Manufacturing Purchasing Managers' Index (PMI) slipped to 49.0 in April from 50.5 in March, falling short of the 49.9 consensus and indicating a return to contraction. The Non-Manufacturing PMI also softened, easing to 50.4 in April from 50.8 in March, below the expected 50.7.
The AUD faced headwinds amid ongoing global trade uncertainties that continue to dampen investor sentiment. Meanwhile, inflationary pressures in Australia in early 2025 have weakened expectations of further monetary easing by the Reserve Bank of Australia (RBA). Markets widely anticipate a 25-basis-point rate cut in May, as policymakers prepare for possible economic fallout from the recently introduced US tariffs.
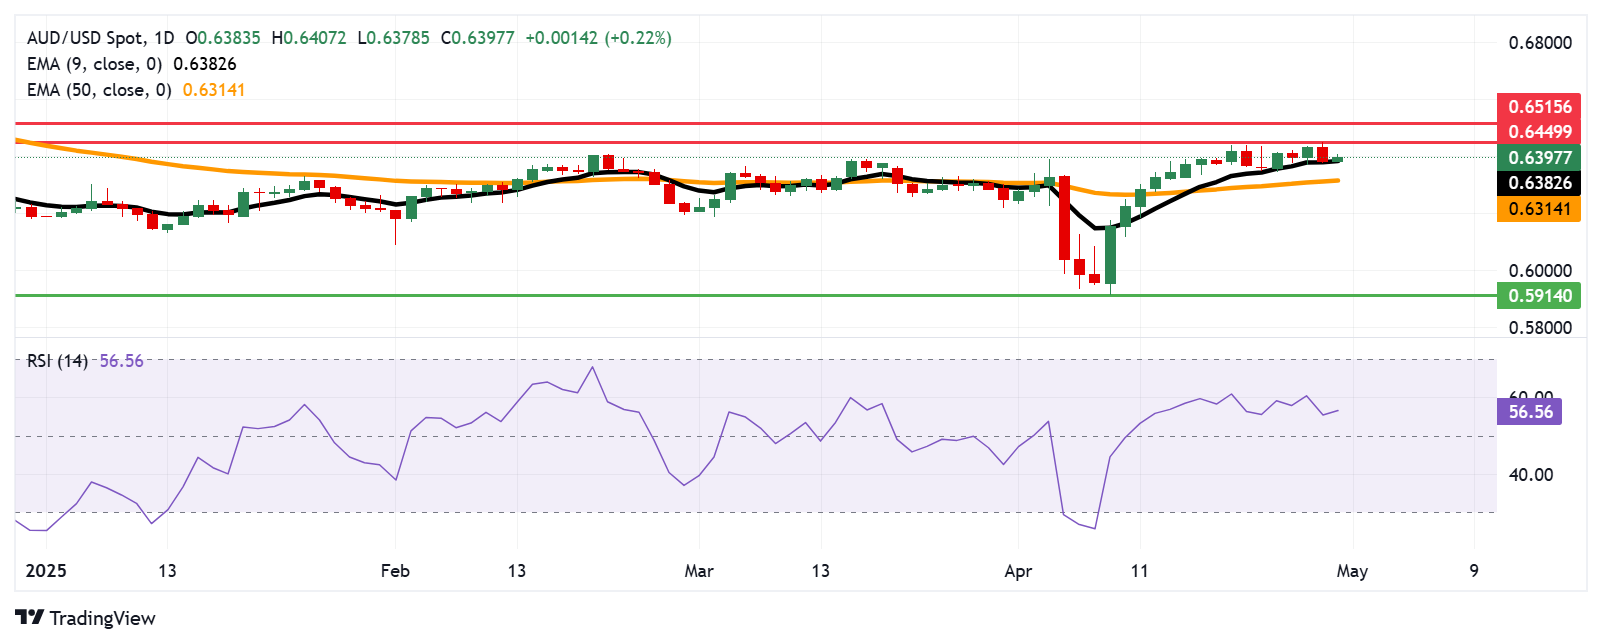
The AUD/USD pair is hovering around 0.6390 on Wednesday, with the daily chart reflecting a bullish outlook. The pair continues to trade above the nine-day Exponential Moving Average (EMA), while the 14-day Relative Strength Index (RSI) holds well above the 50 level--both suggesting sustained upward momentum.
On the upside, immediate resistance is seen at the recent four-month high of 0.6449, which was reached on April 29. A decisive break above this level could pave the way for a move toward the five-month high at 0.6515.
The nine-day EMA at 0.6382 appears as the immediate support, followed by the 50-day EMA at 0.6314. A break below these support levels would weaken the bullish structure and may expose the pair to deeper losses, potentially targeting the March 2020 low around 0.5914.
The table below shows the percentage change of Australian Dollar (AUD) against listed major currencies today. Australian Dollar was the strongest against the Euro.
| USD | EUR | GBP | JPY | CAD | AUD | NZD | CHF | |
|---|---|---|---|---|---|---|---|---|
| USD | 0.24% | 0.12% | 0.07% | 0.06% | -0.22% | 0.01% | 0.03% | |
| EUR | -0.24% | -0.11% | -0.16% | -0.18% | -0.46% | -0.22% | -0.20% | |
| GBP | -0.12% | 0.11% | -0.08% | -0.07% | -0.35% | -0.11% | -0.10% | |
| JPY | -0.07% | 0.16% | 0.08% | -0.02% | -0.29% | 0.00% | -0.02% | |
| CAD | -0.06% | 0.18% | 0.07% | 0.02% | -0.28% | -0.04% | -0.02% | |
| AUD | 0.22% | 0.46% | 0.35% | 0.29% | 0.28% | 0.24% | 0.26% | |
| NZD | -0.01% | 0.22% | 0.11% | -0.00% | 0.04% | -0.24% | 0.02% | |
| CHF | -0.03% | 0.20% | 0.10% | 0.02% | 0.02% | -0.26% | -0.02% |
The heat map shows percentage changes of major currencies against each other. The base currency is picked from the left column, while the quote currency is picked from the top row. For example, if you pick the Australian Dollar from the left column and move along the horizontal line to the US Dollar, the percentage change displayed in the box will represent AUD (base)/USD (quote).
The Monthly Consumer Price Index (CPI), released by the Australian Bureau of Statistics on a monthly basis, measures the changes in the price of a fixed basket of goods and services acquired by household consumers. The indicator was developed to provide inflation data at a higher frequency than the quarterly CPI. The YoY reading compares prices in the reference month to the same month a year earlier. A high reading is seen as bullish for the Australian Dollar (AUD), while a low reading is seen as bearish.
Read more.Last release: Wed Apr 30, 2025 01:30
Frequency: Monthly
Actual: 2.4%
Consensus: -
Previous: 2.4%
Source: Australian Bureau of Statistics
![]()
Created
: 2025.04.30
![]()
Last updated
: 2025.04.30

FXStreet is a forex information website, delivering market analysis and news articles 24/7.
It features a number of articles contributed by well-known analysts, in addition to the ones by its editorial team.
Founded in 2000 by Francesc Riverola, a Spanish economist, it has grown to become a world-renowned information website.
We hope you find this article useful. Any comments or suggestions will be greatly appreciated.
We are also looking for writers with extensive experience in forex and crypto to join us.
please contact us at [email protected].
Disclaimer:![]()
All information and content provided on this website is provided for informational purposes only and is not intended to solicit any investment. Although all efforts are made in order to ensure that the information is correct, no guarantee is provided for the accuracy of any content on this website. Any decision made shall be the responsibility of the investor and Myforex does not take any responsibility whatsoever regarding the use of any information provided herein.
The content provided on this website belongs to Myforex and, where stated, the relevant licensors. All rights are reserved by Myforex and the relevant licensors, and no content of this website, whether in full or in part, shall be copied or displayed elsewhere without the explicit written permission of the relevant copyright holder. If you wish to use any part of the content provided on this website, please ensure that you contact Myforex.
Myforex uses cookies to improve the convenience and functionality of this website. This website may include cookies not only by us but also by third parties (advertisers, log analysts, etc.) for the purpose of tracking the activities of users. Cookie policy
