Created
: 2025.04.30


![]() 2025.04.30 02:29
2025.04.30 02:29
The Dow Jones Industrial Average (DJIA) surged over 300 points or 0.80% on Tuesday as softer-than-expected United States (US) economic data suggested the need for lower interest rates, as witnessed by the fall of US Treasury yields. At the time of writing, the DJIA trades near 40,500 after bouncing off daily lows of 40,150.
Market mood remains positive as the three most important US stock indices register gains, even though they retreated during US Treasury Secretary Scott Bessent's press conference at the White House. He commented on some progress with India and Japan, but failed to clarify regarding trade talks with China.
US Press Secretary Karoline Leavitt revealed that Amazon's shares were punished after reports emerged that Jeff Bezos's company was looking to list product tariff costs on its website. Later, Amazon's spokesperson reported that the label tariff price was never under consideration for the main Amazon website.
Earlier, the US Department of Labor revealed that JOLTS data for March fell to 7.192 million, the lowest level since September, signaling softening labor demand. The reading missed expectations of 7.5 million, down from the previous month's 7.48 million.
Meanwhile, the Conference Board's Consumer Confidence Index dropped sharply in April to 86.0, its lowest in nearly five years. It was down from 93.9 and missed the 87.5 forecast, highlighting growing pessimism among consumers.
After the data, the odds for the May meeting suggest the Fed will hold rates unchanged. Nevertheless, the June meeting is a coin flip, with the chances of lowering borrowing costs standing at 56.8%.
Ahead in the week, traders are eyeing the release of US GDP for Q1 2025, the Core PCE for April, followed by the ISM Manufacturing PMI and Nonfarm Payroll figures.
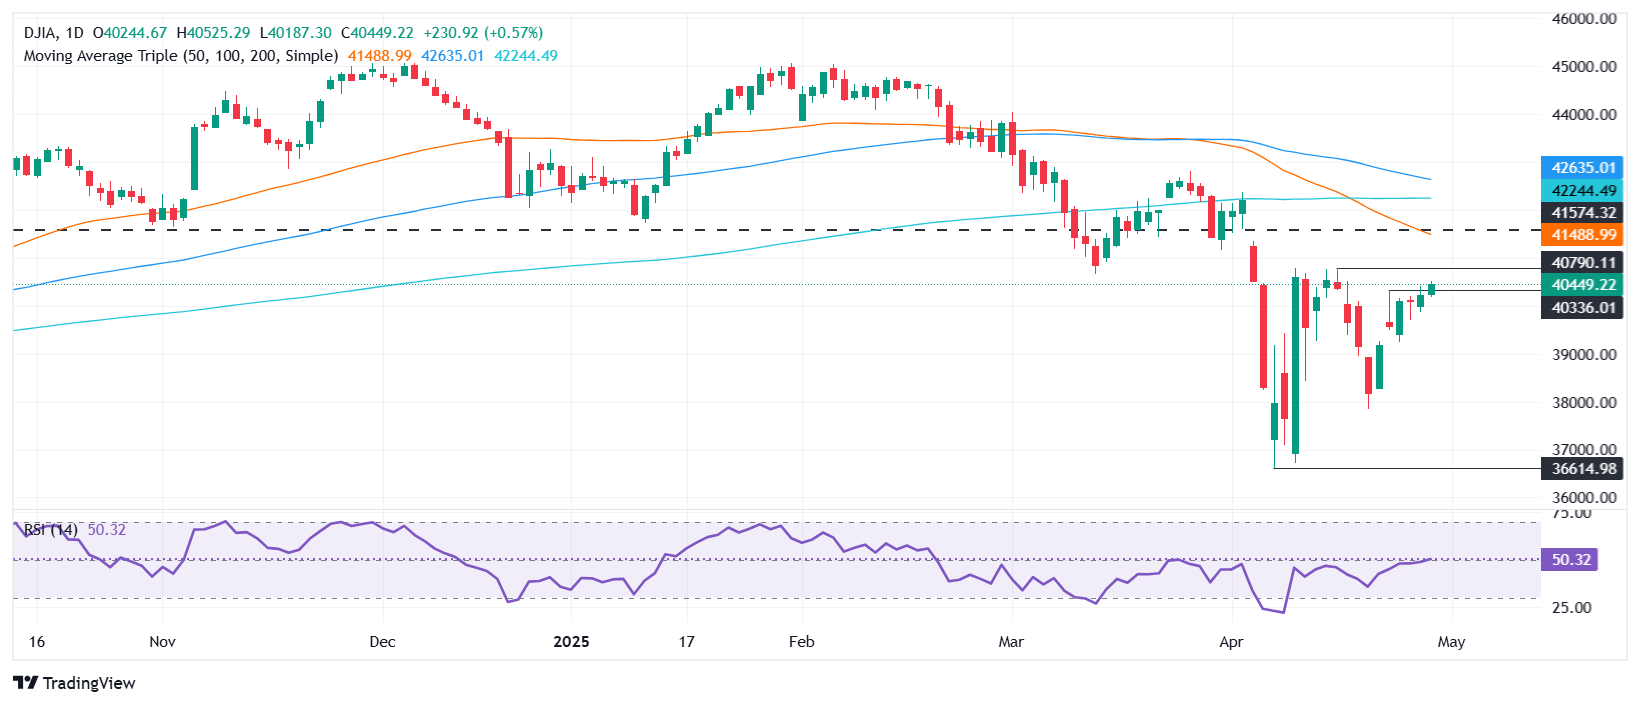
The Dow Jones cleared the 20-day Simple Moving Average (SMA) of 39,800, extending its gains past the 40,000 mark. Although price action suggests buyers are gathering steam, the Relative Strength Index (RSI) is failing to follow suit with price action. This hints that the latest advance could be short-lived and pave the way for a deeper pullback.
Meanwhile, if the Dow clears the 41,000 mark, expect a test of the 50-day SMA at 41,477, followed by the 200-day SMA at 42,272. On further strength, up next lies the 100-day SMA at 42,576.
On the flip side, a drop below 40,000 clears the path to test April 23's low of 39,486, followed by the April 22 high of 39,271 to close the gap witnessed between April 22 and 23.
The Dow Jones Industrial Average, one of the oldest stock market indices in the world, is compiled of the 30 most traded stocks in the US. The index is price-weighted rather than weighted by capitalization. It is calculated by summing the prices of the constituent stocks and dividing them by a factor, currently 0.152. The index was founded by Charles Dow, who also founded the Wall Street Journal. In later years it has been criticized for not being broadly representative enough because it only tracks 30 conglomerates, unlike broader indices such as the S&P 500.
Many different factors drive the Dow Jones Industrial Average (DJIA). The aggregate performance of the component companies revealed in quarterly company earnings reports is the main one. US and global macroeconomic data also contributes as it impacts on investor sentiment. The level of interest rates, set by the Federal Reserve (Fed), also influences the DJIA as it affects the cost of credit, on which many corporations are heavily reliant. Therefore, inflation can be a major driver as well as other metrics which impact the Fed decisions.
Dow Theory is a method for identifying the primary trend of the stock market developed by Charles Dow. A key step is to compare the direction of the Dow Jones Industrial Average (DJIA) and the Dow Jones Transportation Average (DJTA) and only follow trends where both are moving in the same direction. Volume is a confirmatory criteria. The theory uses elements of peak and trough analysis. Dow's theory posits three trend phases: accumulation, when smart money starts buying or selling; public participation, when the wider public joins in; and distribution, when the smart money exits.
There are a number of ways to trade the DJIA. One is to use ETFs which allow investors to trade the DJIA as a single security, rather than having to buy shares in all 30 constituent companies. A leading example is the SPDR Dow Jones Industrial Average ETF (DIA). DJIA futures contracts enable traders to speculate on the future value of the index and Options provide the right, but not the obligation, to buy or sell the index at a predetermined price in the future. Mutual funds enable investors to buy a share of a diversified portfolio of DJIA stocks thus providing exposure to the overall index.
![]()
Created
: 2025.04.30
![]()
Last updated
: 2025.04.30

FXStreet is a forex information website, delivering market analysis and news articles 24/7.
It features a number of articles contributed by well-known analysts, in addition to the ones by its editorial team.
Founded in 2000 by Francesc Riverola, a Spanish economist, it has grown to become a world-renowned information website.
We hope you find this article useful. Any comments or suggestions will be greatly appreciated.
We are also looking for writers with extensive experience in forex and crypto to join us.
please contact us at [email protected].
Disclaimer:![]()
All information and content provided on this website is provided for informational purposes only and is not intended to solicit any investment. Although all efforts are made in order to ensure that the information is correct, no guarantee is provided for the accuracy of any content on this website. Any decision made shall be the responsibility of the investor and Myforex does not take any responsibility whatsoever regarding the use of any information provided herein.
The content provided on this website belongs to Myforex and, where stated, the relevant licensors. All rights are reserved by Myforex and the relevant licensors, and no content of this website, whether in full or in part, shall be copied or displayed elsewhere without the explicit written permission of the relevant copyright holder. If you wish to use any part of the content provided on this website, please ensure that you contact Myforex.
Myforex uses cookies to improve the convenience and functionality of this website. This website may include cookies not only by us but also by third parties (advertisers, log analysts, etc.) for the purpose of tracking the activities of users. Cookie policy
