Created
: 2025.04.23


![]() 2025.04.23 17:53
2025.04.23 17:53
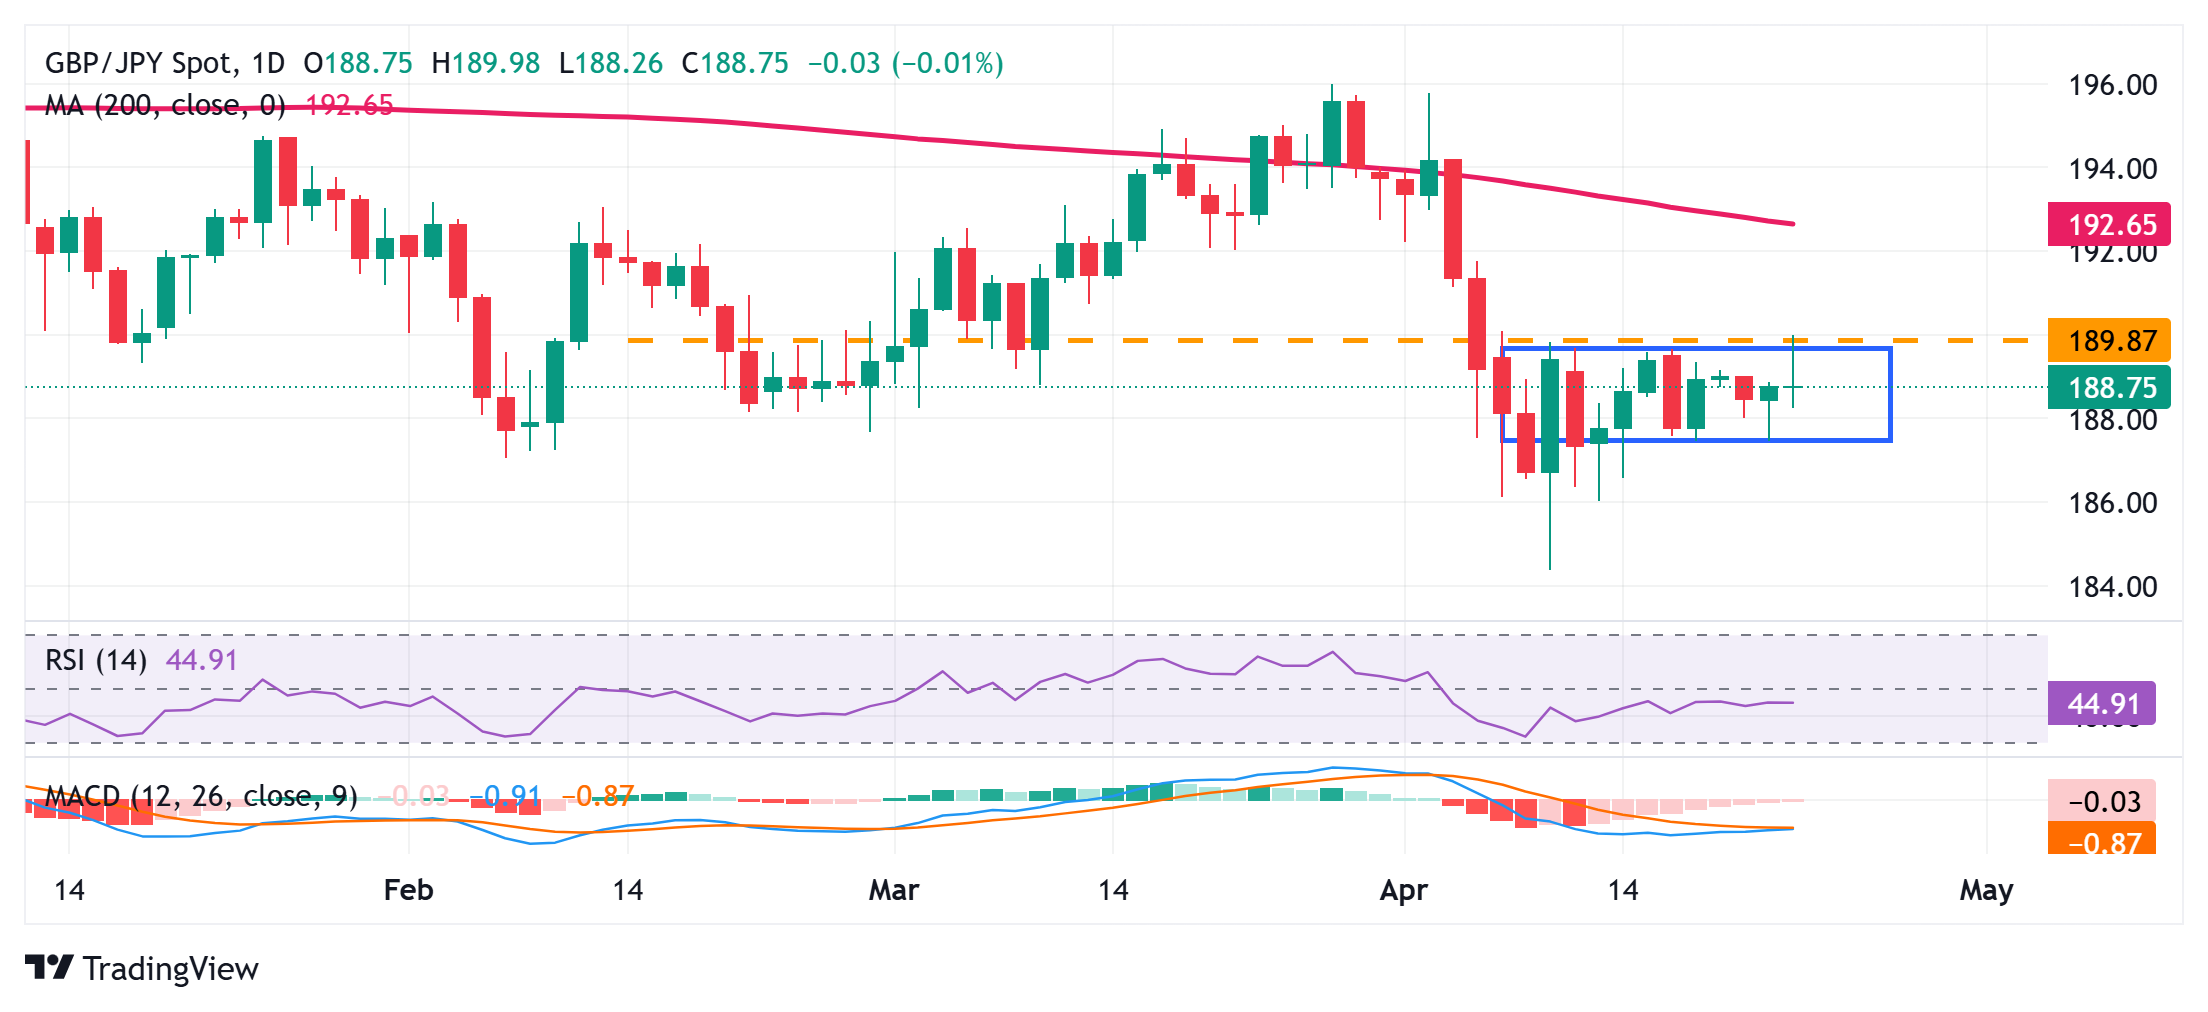
The GBP/JPY cross retreats from the vicinity of the 190.00 psychological mark, or over a two-week top touched earlier this Wednesday. The intraday selling picks up pace in reaction to disappointing UK PMIs and drags spot prices to a fresh daily low, around the 188.25 region during the first half of the European session.
The S&P Global/CIPS UK Manufacturing PMI eased to 44 in April from 44.9 in the previous month, while the Preliminary UK Services Business Activity Index unexpectedly contracted to 48.9. This, along with a modest US Dollar (USD) uptick, continues to weigh on the British Pound (GBP). The Japanese Yen (JPY), on the other hand, continues with its relative outperformance in the wake of hopes for a US-Japan trade deal, which further contributes to the GBP/JPY pair's intraday slide.
Apart from this, expectations that the Bank of Japan (BoJ) will continue raising interest rates and bets that the Bank of England (BoE) will lower borrowing costs suggest that the path of least resistance for spot prices is to the downside. However, the optimism over the potential US-China trade tensions de-escalation remains supportive of the upbeat market mood and might cap gains for the JPY. This, in turn, could lend some support to the GBP/JPY cross and help limit further losses.
Looking at the broader picture, spot prices remain confined in a familiar range held over the past week or so. This might still be categorized as a bullish consolidation phase, warranting some caution before placing aggressive directional bets. Meanwhile, oscillators on the daily chart are holding in negative territory. Moreover, the recent repeated failures to move back above the 190.00 mark validate the near-term negative outlook for the GBP/JPY cross and favor bearish traders.
However, any subsequent slide below the 188.00 mark might continue to find some support near the 187.50-187.45 horizontal zone. A convincing break below will reaffirm the negative bias and make the GBP/JPY cross vulnerable to weaken further below the 187.00 round figure, towards testing the next relevant support near the 186.60-186.55 region. Spot prices could eventually drop to the 186.00 mark, which if broken should pave the way for deeper near-term losses.
On the flip side, any positive move back above the 189.00 mark could face some resistance near the 189.45-189.50 region, above which the GBP/JPY cross could make a fresh attempt to conquer the 190.00 round figure. A sustained strength beyond the latter might shift the bias in favor of bullish traders and trigger a short-covering rally towards the 50-day Simple Moving Average (SMA) hurdle, currently pegged just above the 191.00 mark.
The Composite Purchasing Managers Index (PMI), released on a monthly basis by the Chartered Institute of Procurement & Supply and S&P Global, is a leading indicator gauging private-business activity in UK for both the manufacturing and services sectors. The data is derived from surveys to senior executives. Each response is weighted according to the size of the company and its contribution to total manufacturing or services output accounted for by the sub-sector to which that company belongs. Survey responses reflect the change, if any, in the current month compared to the previous month and can anticipate changing trends in official data series such as Gross Domestic Product (GDP), industrial production, employment and inflation.The index varies between 0 and 100, with levels of 50.0 signaling no change over the previous month. A reading above 50 indicates that the UK private economy is generally expanding, a bullish sign for the Pound Sterling (GBP). Meanwhile, a reading below 50 signals that activity is generally declining, which is seen as bearish for GBP.
Read more.Last release: Wed Apr 23, 2025 08:30 (Prel)
Frequency: Monthly
Actual: 48.2
Consensus: 50.4
Previous: 51.5
Source: S&P Global
![]()
Created
: 2025.04.23
![]()
Last updated
: 2025.04.23

FXStreet is a forex information website, delivering market analysis and news articles 24/7.
It features a number of articles contributed by well-known analysts, in addition to the ones by its editorial team.
Founded in 2000 by Francesc Riverola, a Spanish economist, it has grown to become a world-renowned information website.
We hope you find this article useful. Any comments or suggestions will be greatly appreciated.
We are also looking for writers with extensive experience in forex and crypto to join us.
please contact us at [email protected].
Disclaimer:![]()
All information and content provided on this website is provided for informational purposes only and is not intended to solicit any investment. Although all efforts are made in order to ensure that the information is correct, no guarantee is provided for the accuracy of any content on this website. Any decision made shall be the responsibility of the investor and Myforex does not take any responsibility whatsoever regarding the use of any information provided herein.
The content provided on this website belongs to Myforex and, where stated, the relevant licensors. All rights are reserved by Myforex and the relevant licensors, and no content of this website, whether in full or in part, shall be copied or displayed elsewhere without the explicit written permission of the relevant copyright holder. If you wish to use any part of the content provided on this website, please ensure that you contact Myforex.
Myforex uses cookies to improve the convenience and functionality of this website. This website may include cookies not only by us but also by third parties (advertisers, log analysts, etc.) for the purpose of tracking the activities of users. Cookie policy
