Created
: 2025.04.23


![]() 2025.04.23 12:17
2025.04.23 12:17
Gold price has bounced off the dip to three-day lows near $3,310 early Wednesday as buyers fight back control amid a fading US Dollar (USD) recovery ahead of the US S&P Global preliminary business PMI data release.
Gold price has witnessed volatile trading this week, hitting fresh record highs at $3,500 before facing rejection and slumping toward the $3,300 level. The record run in the Gold price was mainly backed by the markets' anxiety about the US Federal Reserve (Fed) losing its independence following President Donald Trump's verbal attacks on Fed Chair Jerome Powell.
The focus shifted from the US-China trade war to Trump's Fed threat early in the week, exacerbating the US Dollar's pain while driving the Gold price to new all-time highs. However, the tide turned in favor of the Greenback in Tuesday's American trading as USD buyers were rescued by US Treasury Secretary Scott Bessent, who said at a closed event that he expects "there will be a de-escalation" in President Donald Trump's trade war with China in the "very near future."
Hopes of easing US-China trade tensions fuelled a positive shift in risk sentiment and a US Dollar recovery, reflecting an ideal 'Tuesday turnaround.' Investors took this as an excuse to book profits on their Gold long positions as the bright metal corrected as much as $120 from record highs to settle near $3,380.
Gold's corrective downside extends into Asian trading as investors digest the overnight backpedalling by Trump on the US-China trade war and Powell's firing. The US President said that the final tariff rate with China would come down "substantially" from the current 145% but it won't be that high, not going to be that high."
He added that he is willing to strike a trade deal with China, showing his openness for negotiations.
However, the downside in Gold price remains cushioned as the USD stalls its recovery momentum as markets question Trump's intentions, citing them as highly unpredictable.
The attention now turns to the S&P Global preliminary Manufacturing and Services PMI data from Europe and the US for further trading impetus. US PMI data for April will be closely scrutinized for fresh signs on the health of the US economy. The data could help markets alter their expectations of Fed interest rate cuts this year.
Fed fund futures ran into selling late Tuesday as investors scaled back the extent of rate cuts expected by year-end to around 81 basis points (bps).
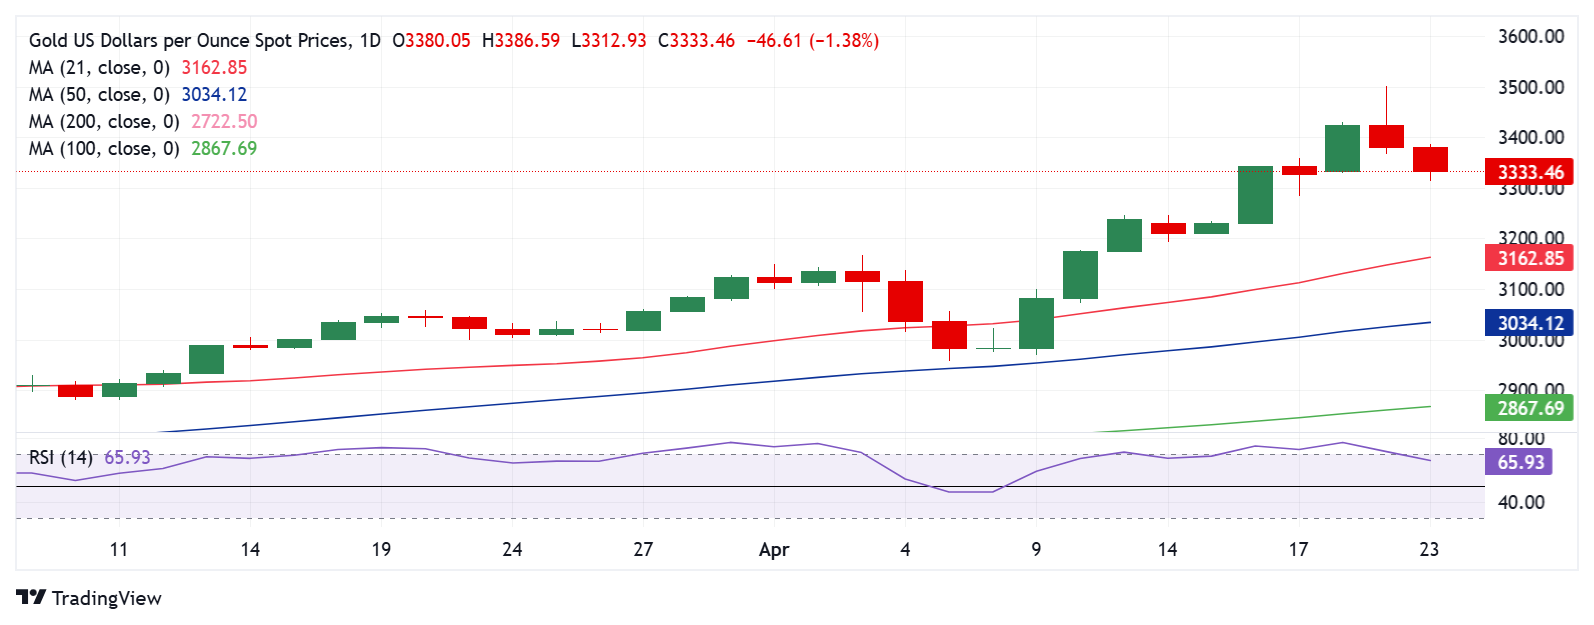
The daily chart shows that the 14-day Relative Strength Index (RSI) has eased from the overbought territory, returning to the bullish zone.
The latest downtick in the leading indicator backs the fresh leg down in Gold price. However, buyers remain hopeful so long as the $3,300 level holds fort.
If the correction deepens, Gold price could challenge the 21-day Simple Moving Average (SMA) at $3,163.
Ahead of that, the $3,200 barrier could provide some support to buyers.
Conversely, if the uptrend resumes, Gold price could retake the $3,400 threshold en-route to the record highs of $3,500.
The S&P Global Manufacturing Purchasing Managers Index (PMI), released on a monthly basis, is a leading indicator gauging business activity in the US manufacturing sector. The data is derived from surveys of senior executives at private-sector companies from the manufacturing sector. Survey responses reflect the change, if any, in the current month compared to the previous month and can anticipate changing trends in official data series such as Gross Domestic Product (GDP), industrial production, employment and inflation. A reading above 50 indicates that the manufacturing economy is generally expanding, a bullish sign for the US Dollar (USD). Meanwhile, a reading below 50 signals that activity in the manufacturing sector is generally declining, which is seen as bearish for USD.
Read more.Next release: Wed Apr 23, 2025 13:45 (Prel)
Frequency: Monthly
Consensus: 49.4
Previous: 50.2
Source: S&P Global
![]()
Created
: 2025.04.23
![]()
Last updated
: 2025.04.23

FXStreet is a forex information website, delivering market analysis and news articles 24/7.
It features a number of articles contributed by well-known analysts, in addition to the ones by its editorial team.
Founded in 2000 by Francesc Riverola, a Spanish economist, it has grown to become a world-renowned information website.
We hope you find this article useful. Any comments or suggestions will be greatly appreciated.
We are also looking for writers with extensive experience in forex and crypto to join us.
please contact us at [email protected].
Disclaimer:![]()
All information and content provided on this website is provided for informational purposes only and is not intended to solicit any investment. Although all efforts are made in order to ensure that the information is correct, no guarantee is provided for the accuracy of any content on this website. Any decision made shall be the responsibility of the investor and Myforex does not take any responsibility whatsoever regarding the use of any information provided herein.
The content provided on this website belongs to Myforex and, where stated, the relevant licensors. All rights are reserved by Myforex and the relevant licensors, and no content of this website, whether in full or in part, shall be copied or displayed elsewhere without the explicit written permission of the relevant copyright holder. If you wish to use any part of the content provided on this website, please ensure that you contact Myforex.
Myforex uses cookies to improve the convenience and functionality of this website. This website may include cookies not only by us but also by third parties (advertisers, log analysts, etc.) for the purpose of tracking the activities of users. Cookie policy
