Created
: 2025.04.22


![]() 2025.04.22 15:58
2025.04.22 15:58
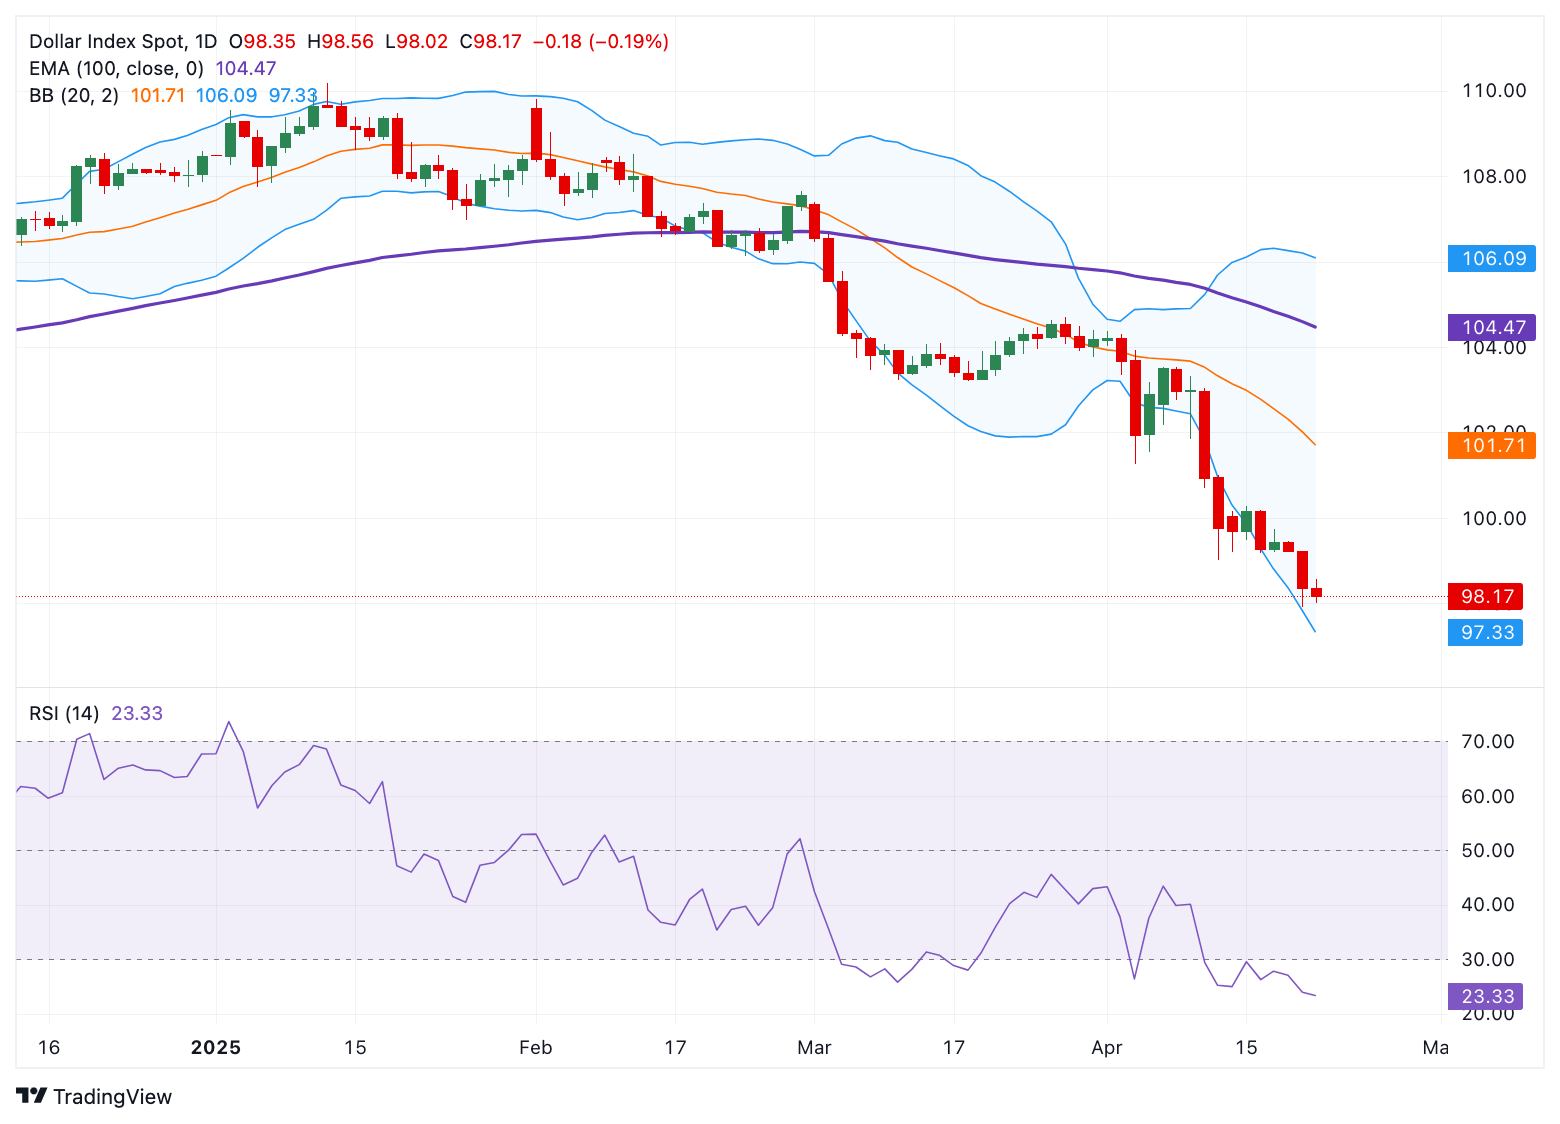
The US Dollar Index (DXY), an index of the value of the US Dollar (USD) measured against a basket of six world currencies, extends its downside to near 98.15, the lowest since March 2022. The USD weakens across the board as fears over the independence of the Federal Reserve (Fed) intensified.
Trump slammed the Fed's Powell for continuing to support a "wait and see" mode on the monetary policy until greater clarity over how the new tariff policy will shape the economic outlook. Trump warned that the US economy would slow unless Powell decided to cut the interest rates immediately. Additionally, the uncertainty surrounding Trump's trade policies and his sweeping tariffs has already shaken global markets, undermining the US Dollar against its rivals in the near term.
Technically, the bearish sentiment of the DXY remains intact as the index holds below the key 100-day Exponential Moving Average (EMA) on the daily chart. The downward momentum is supported by the 14-day Relative Strength Index (RSI), which stands below the midline. Nonetheless, the oversold RSI condition indicates that further consolidation or temporary recovery cannot be ruled out before positioning for any near-term DXY depreciation.
The lower limit of the Bollinger Band at 97.30 acts as an initial support level for the DXY. A breach of this level could drag the index lower to 96.55, the low of February 25, 2022. Extended losses could see a drop to 95.14, the low of February 3, 2022.
On the other hand, the 100.00 psychological level appears to be a tough nut to crack for USD bulls. Any follow-through buying above the mentioned level could pave the way to 101.54, the low of April 4. The key upside barrier for the DXY is seen at 104.45, the 100-day EMA.
The US Dollar (USD) is the official currency of the United States of America, and the 'de facto' currency of a significant number of other countries where it is found in circulation alongside local notes. It is the most heavily traded currency in the world, accounting for over 88% of all global foreign exchange turnover, or an average of $6.6 trillion in transactions per day, according to data from 2022. Following the second world war, the USD took over from the British Pound as the world's reserve currency. For most of its history, the US Dollar was backed by Gold, until the Bretton Woods Agreement in 1971 when the Gold Standard went away.
The most important single factor impacting on the value of the US Dollar is monetary policy, which is shaped by the Federal Reserve (Fed). The Fed has two mandates: to achieve price stability (control inflation) and foster full employment. Its primary tool to achieve these two goals is by adjusting interest rates. When prices are rising too quickly and inflation is above the Fed's 2% target, the Fed will raise rates, which helps the USD value. When inflation falls below 2% or the Unemployment Rate is too high, the Fed may lower interest rates, which weighs on the Greenback.
In extreme situations, the Federal Reserve can also print more Dollars and enact quantitative easing (QE). QE is the process by which the Fed substantially increases the flow of credit in a stuck financial system. It is a non-standard policy measure used when credit has dried up because banks will not lend to each other (out of the fear of counterparty default). It is a last resort when simply lowering interest rates is unlikely to achieve the necessary result. It was the Fed's weapon of choice to combat the credit crunch that occurred during the Great Financial Crisis in 2008. It involves the Fed printing more Dollars and using them to buy US government bonds predominantly from financial institutions. QE usually leads to a weaker US Dollar.
Quantitative tightening (QT) is the reverse process whereby the Federal Reserve stops buying bonds from financial institutions and does not reinvest the principal from the bonds it holds maturing in new purchases. It is usually positive for the US Dollar.
![]()
Created
: 2025.04.22
![]()
Last updated
: 2025.04.22

FXStreet is a forex information website, delivering market analysis and news articles 24/7.
It features a number of articles contributed by well-known analysts, in addition to the ones by its editorial team.
Founded in 2000 by Francesc Riverola, a Spanish economist, it has grown to become a world-renowned information website.
We hope you find this article useful. Any comments or suggestions will be greatly appreciated.
We are also looking for writers with extensive experience in forex and crypto to join us.
please contact us at [email protected].
Disclaimer:![]()
All information and content provided on this website is provided for informational purposes only and is not intended to solicit any investment. Although all efforts are made in order to ensure that the information is correct, no guarantee is provided for the accuracy of any content on this website. Any decision made shall be the responsibility of the investor and Myforex does not take any responsibility whatsoever regarding the use of any information provided herein.
The content provided on this website belongs to Myforex and, where stated, the relevant licensors. All rights are reserved by Myforex and the relevant licensors, and no content of this website, whether in full or in part, shall be copied or displayed elsewhere without the explicit written permission of the relevant copyright holder. If you wish to use any part of the content provided on this website, please ensure that you contact Myforex.
Myforex uses cookies to improve the convenience and functionality of this website. This website may include cookies not only by us but also by third parties (advertisers, log analysts, etc.) for the purpose of tracking the activities of users. Cookie policy
