Created
: 2025.04.21


![]() 2025.04.21 13:38
2025.04.21 13:38
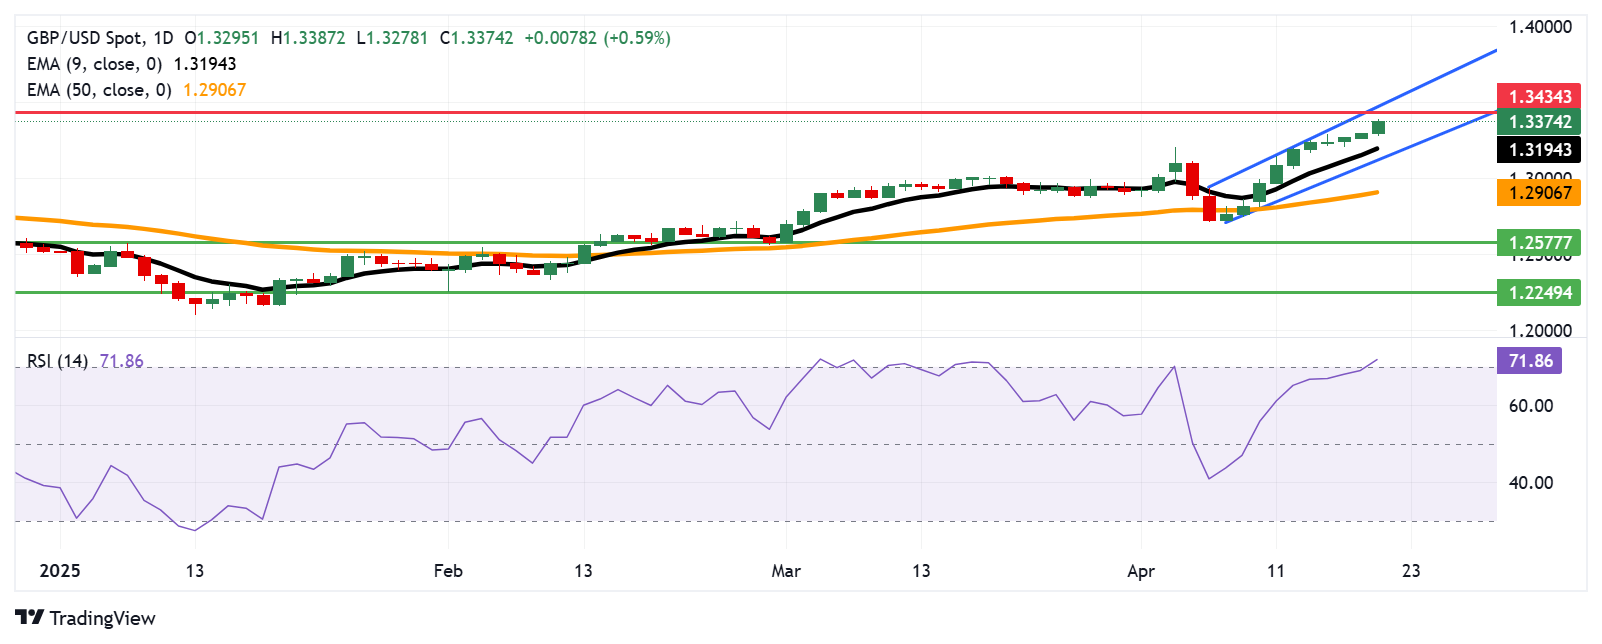
The GBP/USD pair continues its winning streak that began on April 8, trading around 1.3370 during the Asian hours on Monday. Daily chart technical analysis points to a continued bullish trend, with the pair advancing within an ascending channel pattern.
Additionally, the GBP/USD pair continues to trade above the nine-day Exponential Moving Average (EMA), reinforcing the short-term bullish momentum. However, the 14-day Relative Strength Index (RSI) has climbed above 70, indicating overbought conditions and suggesting a potential downside correction may be on the horizon.
The GBP/USD pair encounters initial resistance at the psychological level of 1.3400, followed by 1.3434 -- a level not seen since September 2024 and the lowest since March 2022. A sustained move higher could reinforce the bullish bias, with the pair potentially targeting the ascending channel's upper boundary near 1.3480.
On the downside, immediate support is seen at the nine-day EMA, around 1.3194, followed by the ascending channel's lower boundary near 1.3150. A break below this crucial area could undermine short-term bullish momentum, with the 50-day EMA at 1.2906 emerging as the next significant support level.
A deeper decline below this level could dent the medium-term bullish outlook, potentially driving the GBP/USD pair toward the two-month low of 1.2577, recorded on March 3, and further down to the three-month low of 1.2249, registered on February 3.
The table below shows the percentage change of British Pound (GBP) against listed major currencies today. British Pound was the strongest against the US Dollar.
| USD | EUR | GBP | JPY | CAD | AUD | NZD | CHF | |
|---|---|---|---|---|---|---|---|---|
| USD | -1.03% | -0.63% | -0.86% | -0.36% | -0.51% | -1.04% | -0.96% | |
| EUR | 1.03% | 0.25% | 0.15% | 0.63% | 0.33% | -0.04% | 0.05% | |
| GBP | 0.63% | -0.25% | 0.08% | 0.40% | 0.08% | -0.29% | -0.20% | |
| JPY | 0.86% | -0.15% | -0.08% | 0.50% | 0.21% | -0.07% | -0.07% | |
| CAD | 0.36% | -0.63% | -0.40% | -0.50% | -0.27% | -0.68% | -0.58% | |
| AUD | 0.51% | -0.33% | -0.08% | -0.21% | 0.27% | -0.36% | -0.28% | |
| NZD | 1.04% | 0.04% | 0.29% | 0.07% | 0.68% | 0.36% | 0.12% | |
| CHF | 0.96% | -0.05% | 0.20% | 0.07% | 0.58% | 0.28% | -0.12% |
The heat map shows percentage changes of major currencies against each other. The base currency is picked from the left column, while the quote currency is picked from the top row. For example, if you pick the British Pound from the left column and move along the horizontal line to the US Dollar, the percentage change displayed in the box will represent GBP (base)/USD (quote).
![]()
Created
: 2025.04.21
![]()
Last updated
: 2025.04.21

FXStreet is a forex information website, delivering market analysis and news articles 24/7.
It features a number of articles contributed by well-known analysts, in addition to the ones by its editorial team.
Founded in 2000 by Francesc Riverola, a Spanish economist, it has grown to become a world-renowned information website.
We hope you find this article useful. Any comments or suggestions will be greatly appreciated.
We are also looking for writers with extensive experience in forex and crypto to join us.
please contact us at [email protected].
Disclaimer:![]()
All information and content provided on this website is provided for informational purposes only and is not intended to solicit any investment. Although all efforts are made in order to ensure that the information is correct, no guarantee is provided for the accuracy of any content on this website. Any decision made shall be the responsibility of the investor and Myforex does not take any responsibility whatsoever regarding the use of any information provided herein.
The content provided on this website belongs to Myforex and, where stated, the relevant licensors. All rights are reserved by Myforex and the relevant licensors, and no content of this website, whether in full or in part, shall be copied or displayed elsewhere without the explicit written permission of the relevant copyright holder. If you wish to use any part of the content provided on this website, please ensure that you contact Myforex.
Myforex uses cookies to improve the convenience and functionality of this website. This website may include cookies not only by us but also by third parties (advertisers, log analysts, etc.) for the purpose of tracking the activities of users. Cookie policy
