Created
: 2025.04.14


![]() 2025.04.14 19:51
2025.04.14 19:51
Siver price (XAG/USD) clings to Friday's gains near $32.30 during European trading hours on Monday. The white metal exhibits strength as the US Dollar (USD) continues to dive amid the intensifying trade war between the United States (US) and China.
The US Dollar Index (DXY), which tracks the Greenback's value against six major currencies, slumps to near 99.60.
China has raised import duties on products from the US to 125%, matching the increase in reciprocal tariffs by President Donald Trump as a countermeasure. Such a scenario is unfavorable for the US economy, given that the impact of higher tariffs will be borne by domestic importers. The event is expected to lead to a significant reduction in the purchasing power of households and a slowdown in the workflow of businesses.
The escalating trade war between the world's biggest powerhouses has also diminished demand for US assets. Investors have dumped US Treasury bonds amid firming fears of a US recession. During European trading hours, 10-year US Treasury yields have tumbled over 1% but are still 14% from last week. Theoretically, higher bond yields diminish the demand for non-yielding assets, such as Silver, but heightening global tensions have strengthened the demand for safe-haven assets.
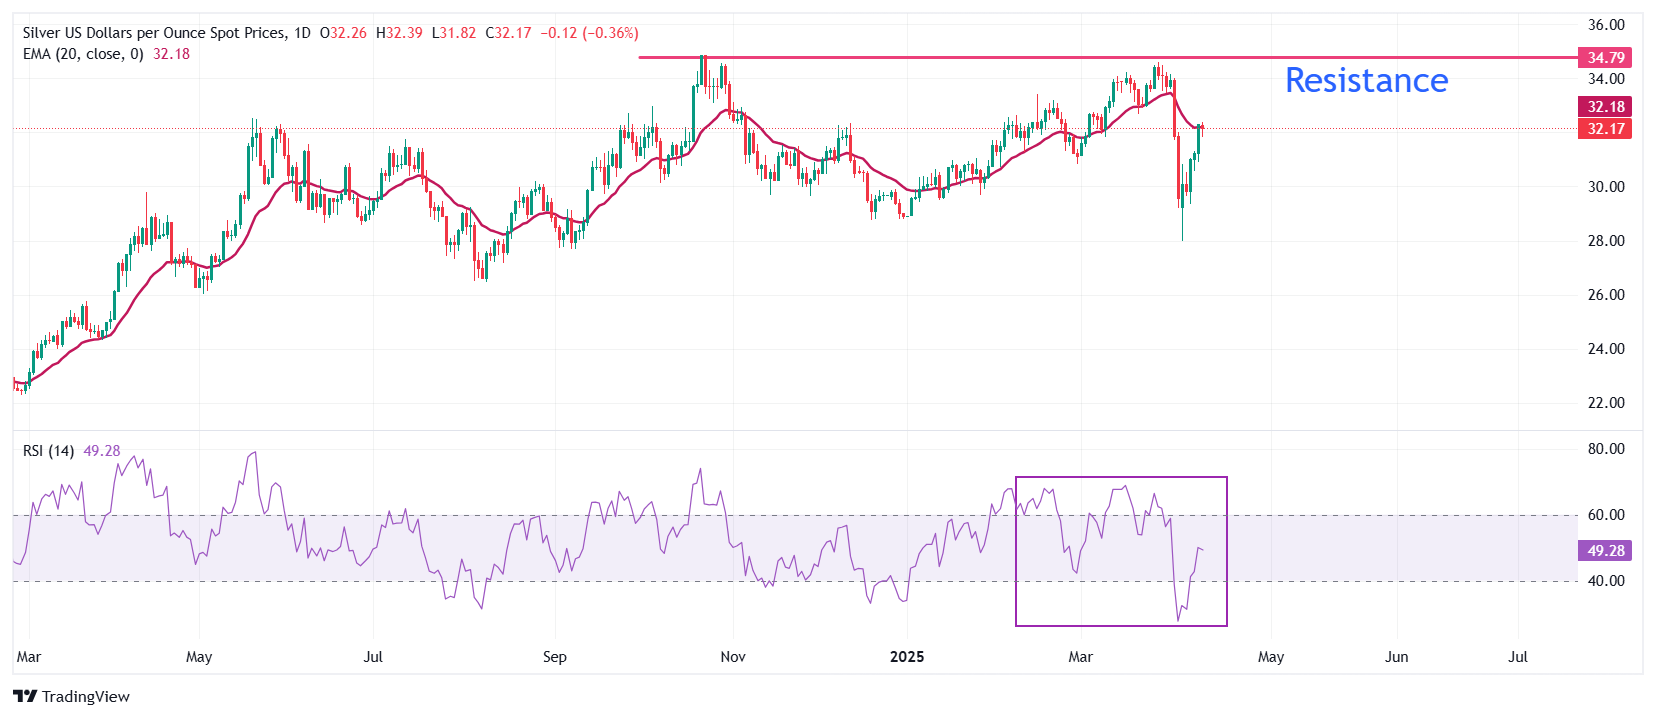
Silver price reclaims the 20-day Exponential Moving Average (EMA) near $32.20 after a rally since a week. The white metal aims to revisit the October 22 high of $34.87.
The 14-day Relative Strength Index (RSI) delivers a V-shape recovery after turning oversold below 30.00. The momentum oscillator is expected to find resistance near 60.00.
Looking down, the April 7 high of $30.81 will be the key support area for the Silver price.
Silver is a precious metal highly traded among investors. It has been historically used as a store of value and a medium of exchange. Although less popular than Gold, traders may turn to Silver to diversify their investment portfolio, for its intrinsic value or as a potential hedge during high-inflation periods. Investors can buy physical Silver, in coins or in bars, or trade it through vehicles such as Exchange Traded Funds, which track its price on international markets.
Silver prices can move due to a wide range of factors. Geopolitical instability or fears of a deep recession can make Silver price escalate due to its safe-haven status, although to a lesser extent than Gold's. As a yieldless asset, Silver tends to rise with lower interest rates. Its moves also depend on how the US Dollar (USD) behaves as the asset is priced in dollars (XAG/USD). A strong Dollar tends to keep the price of Silver at bay, whereas a weaker Dollar is likely to propel prices up. Other factors such as investment demand, mining supply - Silver is much more abundant than Gold - and recycling rates can also affect prices.
Silver is widely used in industry, particularly in sectors such as electronics or solar energy, as it has one of the highest electric conductivity of all metals - more than Copper and Gold. A surge in demand can increase prices, while a decline tends to lower them. Dynamics in the US, Chinese and Indian economies can also contribute to price swings: for the US and particularly China, their big industrial sectors use Silver in various processes; in India, consumers' demand for the precious metal for jewellery also plays a key role in setting prices.
Silver prices tend to follow Gold's moves. When Gold prices rise, Silver typically follows suit, as their status as safe-haven assets is similar. The Gold/Silver ratio, which shows the number of ounces of Silver needed to equal the value of one ounce of Gold, may help to determine the relative valuation between both metals. Some investors may consider a high ratio as an indicator that Silver is undervalued, or Gold is overvalued. On the contrary, a low ratio might suggest that Gold is undervalued relative to Silver.
![]()
Created
: 2025.04.14
![]()
Last updated
: 2025.04.14

FXStreet is a forex information website, delivering market analysis and news articles 24/7.
It features a number of articles contributed by well-known analysts, in addition to the ones by its editorial team.
Founded in 2000 by Francesc Riverola, a Spanish economist, it has grown to become a world-renowned information website.
We hope you find this article useful. Any comments or suggestions will be greatly appreciated.
We are also looking for writers with extensive experience in forex and crypto to join us.
please contact us at [email protected].
Disclaimer:![]()
All information and content provided on this website is provided for informational purposes only and is not intended to solicit any investment. Although all efforts are made in order to ensure that the information is correct, no guarantee is provided for the accuracy of any content on this website. Any decision made shall be the responsibility of the investor and Myforex does not take any responsibility whatsoever regarding the use of any information provided herein.
The content provided on this website belongs to Myforex and, where stated, the relevant licensors. All rights are reserved by Myforex and the relevant licensors, and no content of this website, whether in full or in part, shall be copied or displayed elsewhere without the explicit written permission of the relevant copyright holder. If you wish to use any part of the content provided on this website, please ensure that you contact Myforex.
Myforex uses cookies to improve the convenience and functionality of this website. This website may include cookies not only by us but also by third parties (advertisers, log analysts, etc.) for the purpose of tracking the activities of users. Cookie policy
