Created
: 2025.04.14


![]() 2025.04.14 18:07
2025.04.14 18:07
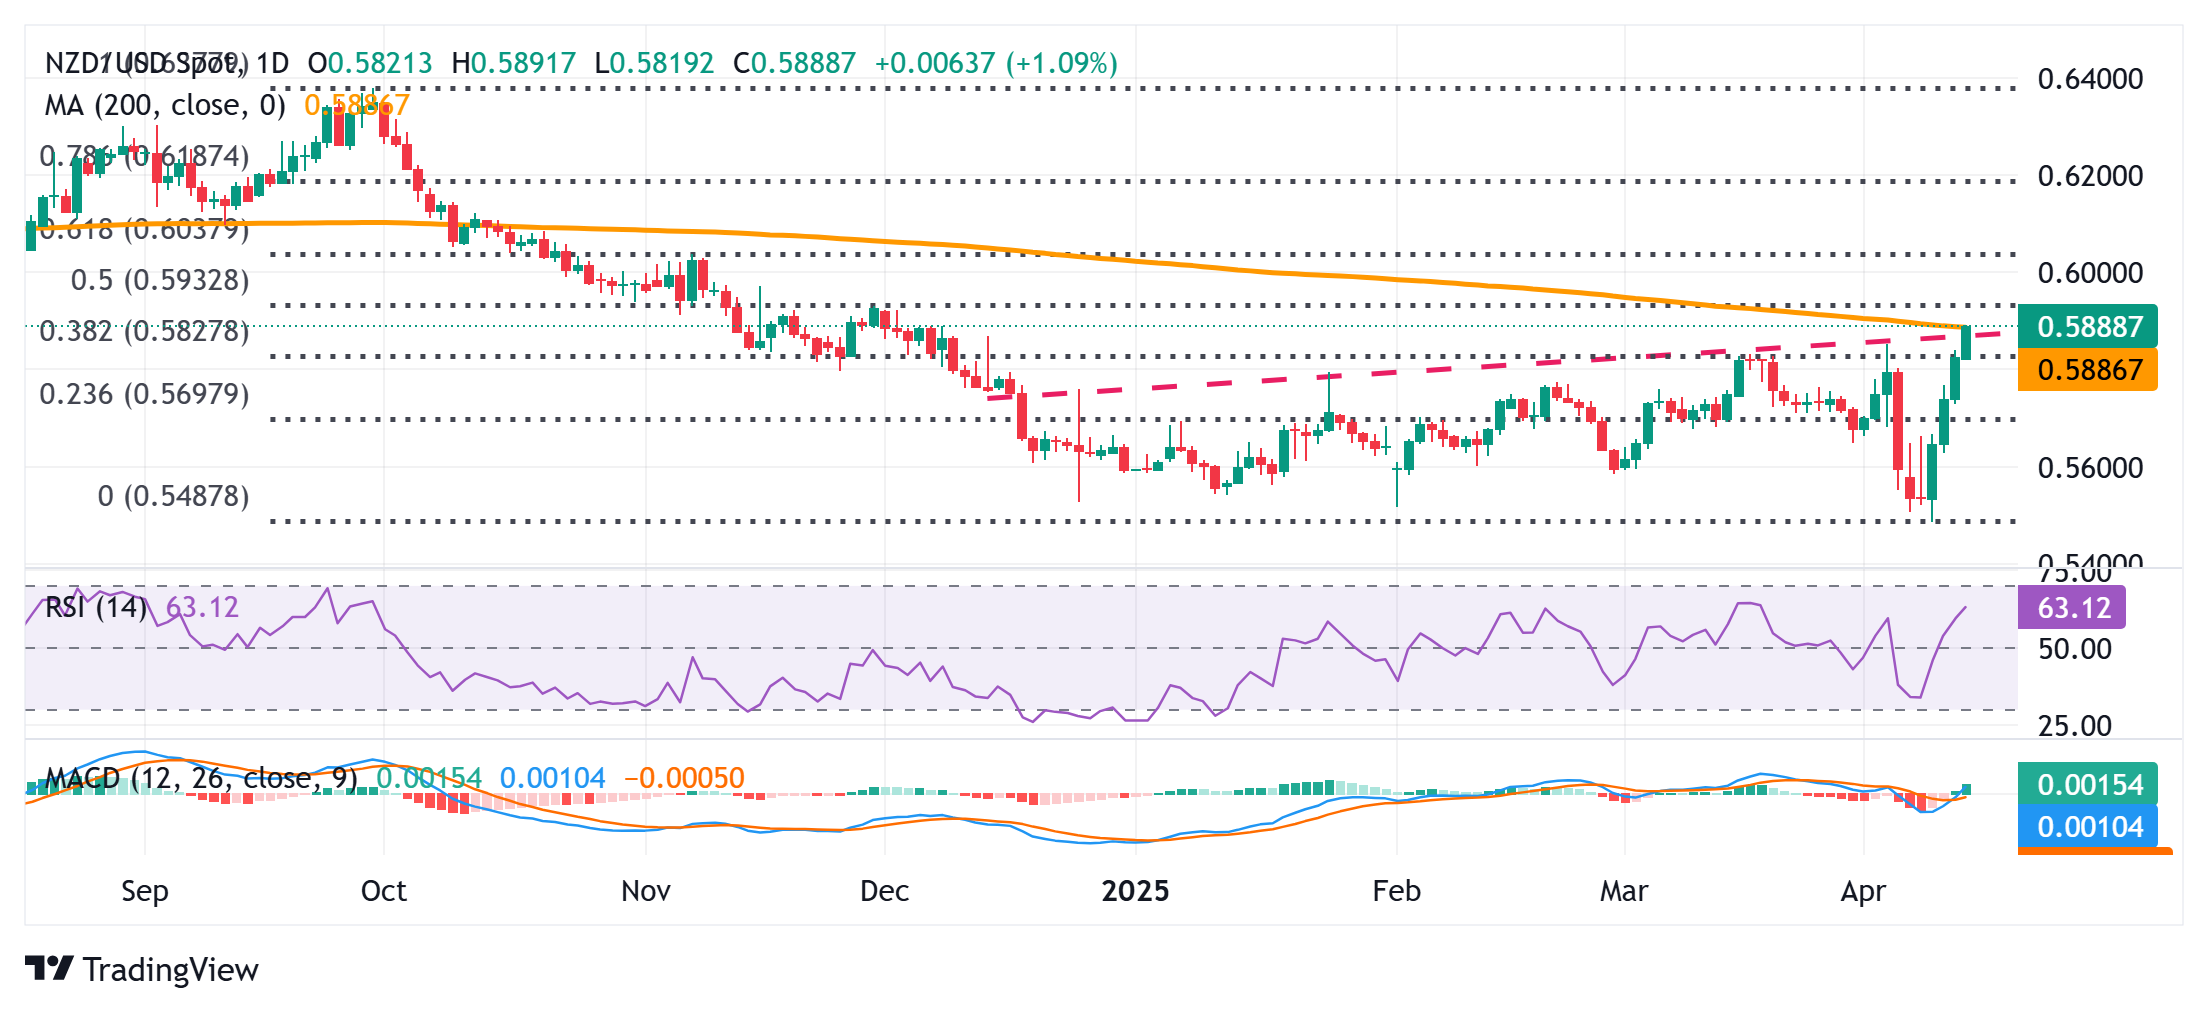
The NZD/USD pair is seen building on last week's solid recovery from the 0.5485 region, or its lowest level since March 2020, and gaining strong follow-through positive traction for the fourth successive day on Monday. The buying interest remains unabated through the first half of the European session amid a broadly weaker US Dollar (USD) and lifts spot prices to the 0.5900 neighborhood, or a fresh year-to-date high.
The aforementioned handle represents a confluence hurdle comprising a technically significant 200-day Simple Moving Average (SMA) and a multi-month-old ascending trend-line. Meanwhile, an intraday breakout above the 0.5825-0.5830 region, or the 38.2% Fibonacci retracement level of the September 2024-April 2025 downfall could be seen as a fresh trigger for bullish traders. This, along with positive oscillators on the daily chart, suggests that the path of least resistance for the NZD/USD pair is to the upside.
That said, it will still be prudent to wait for a sustained breakout and acceptance above the 0.5900 mark before positioning for further gains. Spot prices might then surpass the 50% Fibo. level, around the 0.5930-0.5935 region, and climb further towards the 0.6000 psychological mark en route to the 0.6035-0.6040 area, or the 61.8% Fibo. level. The subsequent move up will suggest that the NZD/USD pair has formed a near-term bottom and pave the way for a further near-term appreciating move.
On the flip side, any corrective pullback now seems to find decent support near the 0.5825-0.5830 region (38.2% Fibo. level). This is followed by the 0.5800 mark, which if broken decisively might prompt some technical selling and drag the NZD/USD pair to the 0.5765-0.5760 intermediate support en route to the 0.5700 round figure, or the 23.6% Fibo. level. The latter should act as a key pivotal point and strong base for spot prices. A convincing break below, however, might shift the bias in favor of bearish traders.
The New Zealand Dollar (NZD), also known as the Kiwi, is a well-known traded currency among investors. Its value is broadly determined by the health of the New Zealand economy and the country's central bank policy. Still, there are some unique particularities that also can make NZD move. The performance of the Chinese economy tends to move the Kiwi because China is New Zealand's biggest trading partner. Bad news for the Chinese economy likely means less New Zealand exports to the country, hitting the economy and thus its currency. Another factor moving NZD is dairy prices as the dairy industry is New Zealand's main export. High dairy prices boost export income, contributing positively to the economy and thus to the NZD.
The Reserve Bank of New Zealand (RBNZ) aims to achieve and maintain an inflation rate between 1% and 3% over the medium term, with a focus to keep it near the 2% mid-point. To this end, the bank sets an appropriate level of interest rates. When inflation is too high, the RBNZ will increase interest rates to cool the economy, but the move will also make bond yields higher, increasing investors' appeal to invest in the country and thus boosting NZD. On the contrary, lower interest rates tend to weaken NZD. The so-called rate differential, or how rates in New Zealand are or are expected to be compared to the ones set by the US Federal Reserve, can also play a key role in moving the NZD/USD pair.
Macroeconomic data releases in New Zealand are key to assess the state of the economy and can impact the New Zealand Dollar's (NZD) valuation. A strong economy, based on high economic growth, low unemployment and high confidence is good for NZD. High economic growth attracts foreign investment and may encourage the Reserve Bank of New Zealand to increase interest rates, if this economic strength comes together with elevated inflation. Conversely, if economic data is weak, NZD is likely to depreciate.
The New Zealand Dollar (NZD) tends to strengthen during risk-on periods, or when investors perceive that broader market risks are low and are optimistic about growth. This tends to lead to a more favorable outlook for commodities and so-called 'commodity currencies' such as the Kiwi. Conversely, NZD tends to weaken at times of market turbulence or economic uncertainty as investors tend to sell higher-risk assets and flee to the more-stable safe havens.
![]()
Created
: 2025.04.14
![]()
Last updated
: 2025.04.14

FXStreet is a forex information website, delivering market analysis and news articles 24/7.
It features a number of articles contributed by well-known analysts, in addition to the ones by its editorial team.
Founded in 2000 by Francesc Riverola, a Spanish economist, it has grown to become a world-renowned information website.
We hope you find this article useful. Any comments or suggestions will be greatly appreciated.
We are also looking for writers with extensive experience in forex and crypto to join us.
please contact us at [email protected].
Disclaimer:![]()
All information and content provided on this website is provided for informational purposes only and is not intended to solicit any investment. Although all efforts are made in order to ensure that the information is correct, no guarantee is provided for the accuracy of any content on this website. Any decision made shall be the responsibility of the investor and Myforex does not take any responsibility whatsoever regarding the use of any information provided herein.
The content provided on this website belongs to Myforex and, where stated, the relevant licensors. All rights are reserved by Myforex and the relevant licensors, and no content of this website, whether in full or in part, shall be copied or displayed elsewhere without the explicit written permission of the relevant copyright holder. If you wish to use any part of the content provided on this website, please ensure that you contact Myforex.
Myforex uses cookies to improve the convenience and functionality of this website. This website may include cookies not only by us but also by third parties (advertisers, log analysts, etc.) for the purpose of tracking the activities of users. Cookie policy
