Created
: 2025.04.12


![]() 2025.04.12 00:23
2025.04.12 00:23
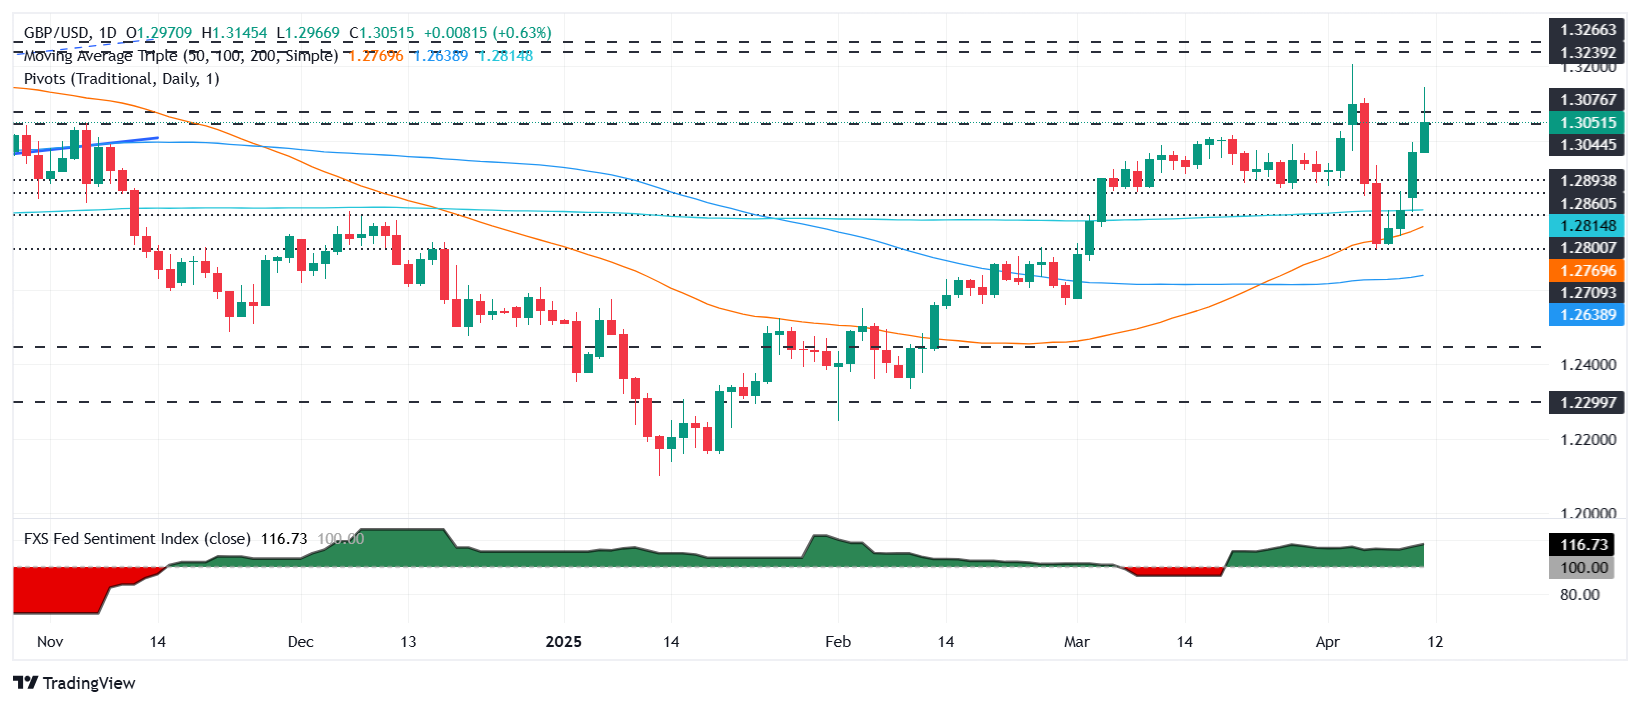
The Pound Sterling extends its gains versus the US Dollar as the US-Sino trade war escalates, with China imposing 125% tariffs on US goods. Trade policies continue to drive price action, with economic data taking a backseat. At the time of writing, the GBP/USD trades at 1.3067, up 0.77%.
Breaking news revealed that China retaliated against US President Donald Trump's decision to increase duties to 145% on Chinese products. Beijing called the actions a "joke" and said it no longer considers them worth matching.
The economic docket revealed that US Consumer Sentiment deteriorated, according to the University of Michigan. The Index dipped from 57.0 to 50.8 in April. Inflation expectations for one year rose from 5% to 6.7%, and for a five-year period, they increased from 4.1% to 4.4%.
The US Producer Price Index (PPI) fell from 3.2% to 2.7% YoY in March, below estimates of 3.3%. Despite this, Core PPI remained above the 3% threshold at 3.3% YoY, below February's 3.5%, lower than forecasts of 3.6%.
Meanwhile, Federal Reserve speakers crossed the wires. Minneapolis Neel Kashkari said the CPI report contained good news, though he reaffirmed that inflation remains elevated. Boston Fed Susan Collins said her outlook for the year is higher inflation and slower growth, while St. Louis Fed Alberto Musalem said inflation could climb even as the labor market softens.
Across the pond, the UK's economy grew above estimates, rising 0.5% in February, beating economists' estimates and providing some relief for Chancellor Rachel Reeves.
Given the backdrop, uncertainty about trade keeps the GBP/USD trading above the 1.30 figure. This opens the door to re-testing six-month peaks reached on April 3 at 1.3207, which, once cleared, puts the 1.3300 figure up for grabs. The Relative Strength Index (RSI) shows that buyers are gathering momentum.
On the other hand, if GBP/USD retreats below 1.30, immediate support emerges at April 11 daily low of 1.2968. A breach of the latter will expose 1.2900 and the 200-day Simple Moving Average (SMA) at 1.2815.
The table below shows the percentage change of British Pound (GBP) against listed major currencies this week. British Pound was the strongest against the US Dollar.
| USD | EUR | GBP | JPY | CAD | AUD | NZD | CHF | |
|---|---|---|---|---|---|---|---|---|
| USD | -3.23% | -1.27% | -1.38% | -2.44% | -3.04% | -3.57% | -4.63% | |
| EUR | 3.23% | 2.32% | 2.57% | 1.45% | 0.12% | 0.26% | -0.84% | |
| GBP | 1.27% | -2.32% | -1.05% | -0.85% | -2.12% | -2.01% | -3.09% | |
| JPY | 1.38% | -2.57% | 1.05% | -1.06% | -0.74% | -1.03% | -2.98% | |
| CAD | 2.44% | -1.45% | 0.85% | 1.06% | -0.95% | -1.15% | -2.51% | |
| AUD | 3.04% | -0.12% | 2.12% | 0.74% | 0.95% | 0.12% | -0.98% | |
| NZD | 3.57% | -0.26% | 2.01% | 1.03% | 1.15% | -0.12% | -1.10% | |
| CHF | 4.63% | 0.84% | 3.09% | 2.98% | 2.51% | 0.98% | 1.10% |
The heat map shows percentage changes of major currencies against each other. The base currency is picked from the left column, while the quote currency is picked from the top row. For example, if you pick the British Pound from the left column and move along the horizontal line to the US Dollar, the percentage change displayed in the box will represent GBP (base)/USD (quote).
![]()
Created
: 2025.04.12
![]()
Last updated
: 2025.04.12

FXStreet is a forex information website, delivering market analysis and news articles 24/7.
It features a number of articles contributed by well-known analysts, in addition to the ones by its editorial team.
Founded in 2000 by Francesc Riverola, a Spanish economist, it has grown to become a world-renowned information website.
We hope you find this article useful. Any comments or suggestions will be greatly appreciated.
We are also looking for writers with extensive experience in forex and crypto to join us.
please contact us at [email protected].
Disclaimer:![]()
All information and content provided on this website is provided for informational purposes only and is not intended to solicit any investment. Although all efforts are made in order to ensure that the information is correct, no guarantee is provided for the accuracy of any content on this website. Any decision made shall be the responsibility of the investor and Myforex does not take any responsibility whatsoever regarding the use of any information provided herein.
The content provided on this website belongs to Myforex and, where stated, the relevant licensors. All rights are reserved by Myforex and the relevant licensors, and no content of this website, whether in full or in part, shall be copied or displayed elsewhere without the explicit written permission of the relevant copyright holder. If you wish to use any part of the content provided on this website, please ensure that you contact Myforex.
Myforex uses cookies to improve the convenience and functionality of this website. This website may include cookies not only by us but also by third parties (advertisers, log analysts, etc.) for the purpose of tracking the activities of users. Cookie policy
