Created
: 2025.04.10


![]() 2025.04.10 10:56
2025.04.10 10:56
The Australian Dollar (AUD) edged lower against the US Dollar (USD) on Thursday, retracing some of its over 3% gain from the previous session. The AUD/USD pair weakened after US President Donald Trump escalated trade tensions with China by raising tariffs on Chinese imports to 125%, prompting concern due to Australia's close trade ties with China.
China is increasing tariffs on all US imports to 84% and added six American firms--such as defense and aerospace companies Shield AI and Sierra Nevada--to its trade blacklist. It also imposed export controls on a dozen US companies, including American Photonics and BRINC Drones.
China's Consumer Price Index (CPI) fell 0.1% year-over-year in March, following a 0.7% decline in February and missing the forecasted 0.1% rise. Monthly CPI inflation depreciated by 0.4%, worse than February's 0.2% decline and market expectations. Meanwhile, the Producer Price Index (PPI) dropped 2.5% annually in March, deeper than the 2.2% fall in February and the projected 2.3% decline.
Australia's economic outlook remains fragile, with business and consumer confidence lagging. The weak data has strengthened expectations of a more dovish Reserve Bank of Australia (RBA), with markets now pricing in up to 100 basis points in rate cuts this year--beginning in May, with further reductions expected in July and August.
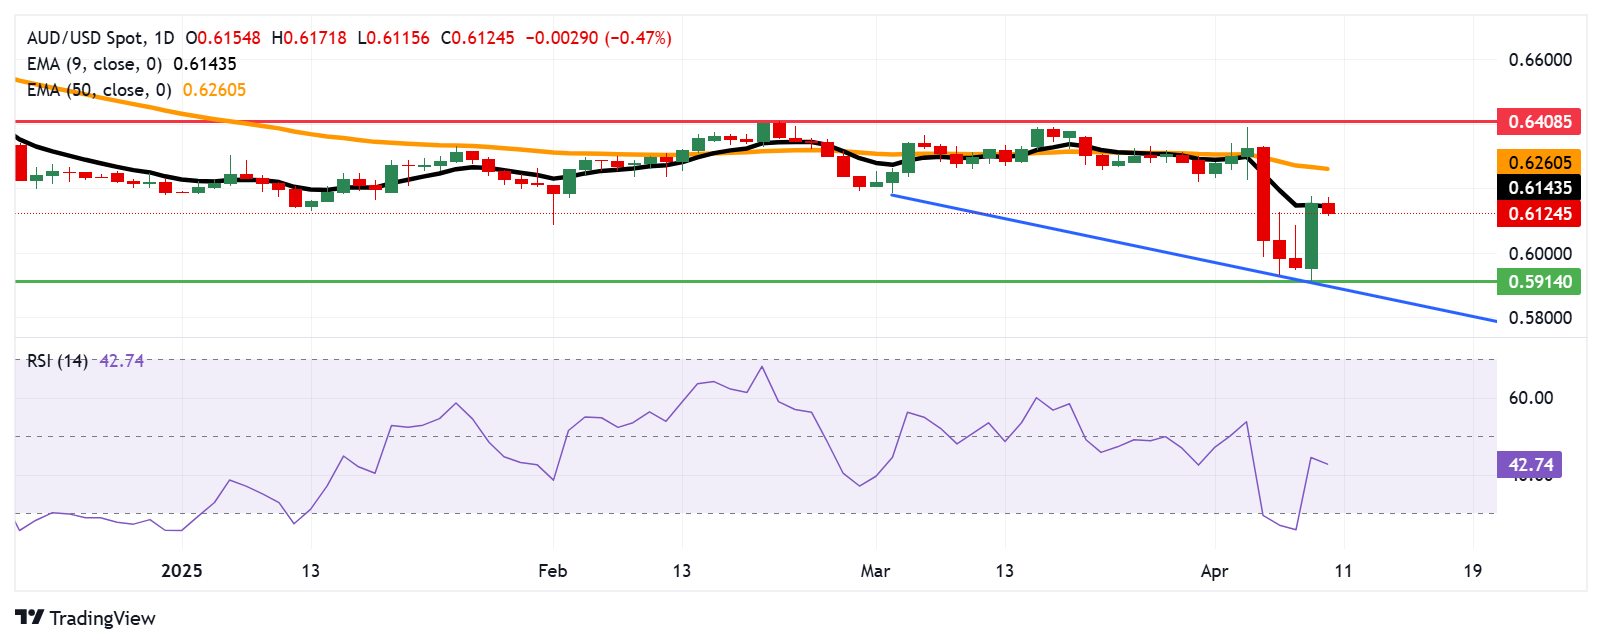
The AUD/USD pair is trading near 0.6120 on Thursday, with technical indicators on the daily chart pointing to a sustained bearish bias, as the pair has retreated from the nine-day Exponential Moving Average (EMA). Additionally, the 14-day Relative Strength Index (RSI) sits below 50, suggesting the reinforcement of the bearish bias.
Immediate support is seen at the 0.5914--marking the lowest level since March 2020, followed by the descending trendline at the 0.5900 level.
On the upside, initial resistance lies at the nine-day EMA around 0.6143, followed by the 50-day EMA at 0.6260. A stronger recovery could be seen in the pair, testing the four-month high at 0.6408.
The table below shows the percentage change of Australian Dollar (AUD) against listed major currencies today. Australian Dollar was the weakest against the Swiss Franc.
| USD | EUR | GBP | JPY | CAD | AUD | NZD | CHF | |
|---|---|---|---|---|---|---|---|---|
| USD | -0.26% | 0.16% | -0.60% | 0.16% | 0.44% | 0.22% | -0.50% | |
| EUR | 0.26% | 0.18% | -0.35% | 0.40% | 0.67% | 0.44% | -0.27% | |
| GBP | -0.16% | -0.18% | -0.51% | 0.22% | 0.48% | 0.25% | -0.56% | |
| JPY | 0.60% | 0.35% | 0.51% | 0.74% | 1.03% | 0.76% | 0.21% | |
| CAD | -0.16% | -0.40% | -0.22% | -0.74% | 0.27% | 0.05% | -0.78% | |
| AUD | -0.44% | -0.67% | -0.48% | -1.03% | -0.27% | -0.23% | -1.03% | |
| NZD | -0.22% | -0.44% | -0.25% | -0.76% | -0.05% | 0.23% | -0.81% | |
| CHF | 0.50% | 0.27% | 0.56% | -0.21% | 0.78% | 1.03% | 0.81% |
The heat map shows percentage changes of major currencies against each other. The base currency is picked from the left column, while the quote currency is picked from the top row. For example, if you pick the Australian Dollar from the left column and move along the horizontal line to the US Dollar, the percentage change displayed in the box will represent AUD (base)/USD (quote).
The Consumer Price Index (CPI), released by the National Bureau of Statistics of China on a monthly basis, measures changes in the price level of consumer goods and services purchased by residents. The CPI is a key indicator to measure inflation and changes in purchasing trends. The YoY reading compares prices in the reference month to the same month a year earlier. Generally, a high reading is seen as bullish for the Renminbi (CNY), while a low reading is seen as bearish.
Read more.Last release: Thu Apr 10, 2025 01:30
Frequency: Monthly
Actual: -0.1%
Consensus: 0.1%
Previous: -0.7%
![]()
Created
: 2025.04.10
![]()
Last updated
: 2025.04.10

FXStreet is a forex information website, delivering market analysis and news articles 24/7.
It features a number of articles contributed by well-known analysts, in addition to the ones by its editorial team.
Founded in 2000 by Francesc Riverola, a Spanish economist, it has grown to become a world-renowned information website.
We hope you find this article useful. Any comments or suggestions will be greatly appreciated.
We are also looking for writers with extensive experience in forex and crypto to join us.
please contact us at [email protected].
Disclaimer:![]()
All information and content provided on this website is provided for informational purposes only and is not intended to solicit any investment. Although all efforts are made in order to ensure that the information is correct, no guarantee is provided for the accuracy of any content on this website. Any decision made shall be the responsibility of the investor and Myforex does not take any responsibility whatsoever regarding the use of any information provided herein.
The content provided on this website belongs to Myforex and, where stated, the relevant licensors. All rights are reserved by Myforex and the relevant licensors, and no content of this website, whether in full or in part, shall be copied or displayed elsewhere without the explicit written permission of the relevant copyright holder. If you wish to use any part of the content provided on this website, please ensure that you contact Myforex.
Myforex uses cookies to improve the convenience and functionality of this website. This website may include cookies not only by us but also by third parties (advertisers, log analysts, etc.) for the purpose of tracking the activities of users. Cookie policy
