Created
: 2025.04.09


![]() 2025.04.09 13:09
2025.04.09 13:09
Gold price (XAU/USD) regains positive traction following the previous day's failed attempt to surpass the $3,022-3,023 hurdle and retakes the $3,000 psychological mark during the Asian session on Wednesday. Persistent worries about escalating trade tensions and fears of a recession continue to prompt investors to take refuge in the traditional safe-haven bullion. Apart from this, bets for multiple rate cuts by the Federal Reserve (Fed) this year and some follow-through US Dollar (USD) selling for the second straight day turn out to be key factors that underpin the non-yielding yellow metal.
Meanwhile, speculation that China is dumping US Treasuries in retaliation to the sweeping US tariffs led to an extended selloff in US government bonds. This might hold back traders from placing fresh bullish bets around the Gold price and cap any further gains ahead of the release of FOMC meeting minutes later this Wednesday. Investors this week will further take cues from the US inflation figures for cues about the Fed's rate-cut path, which would influence the XAU/USD. This warrants caution before confirming that the commodity's recent pullback from the all-time peak has run its course.
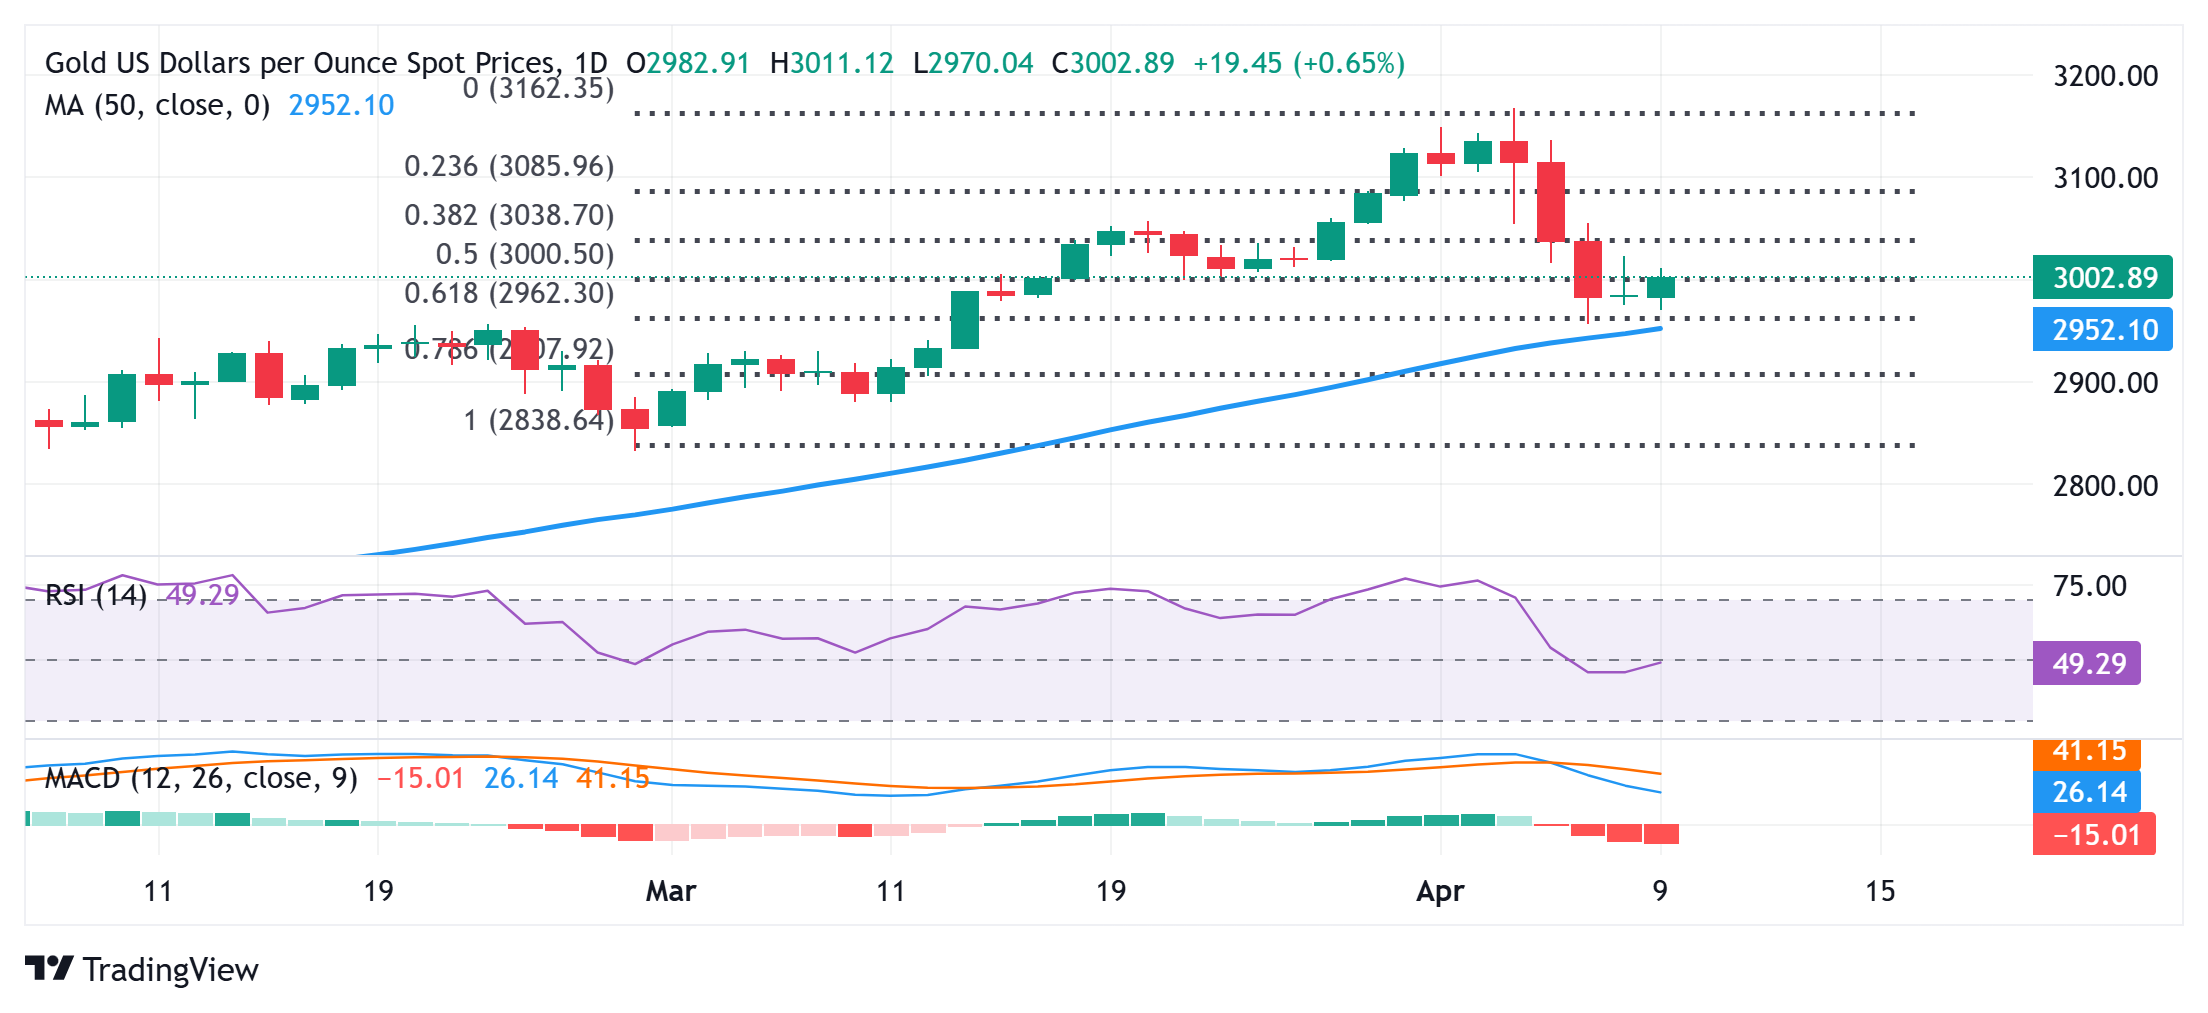
From a technical perspective, the recent sharp decline from the record high stalled near the 61.8% Fibonacci retracement level of the February-April move-up. The said support is pegged near the $2,957-2,956 area, or a multi-week low touched on Monday and is closely followed by the 50-day SMA, currently around the $2,952 region. A convincing break below the latter will be seen as a fresh trigger for bearish traders and drag the Gold price to the next relevant support near the $2,920 horizontal zone en route to the $2,900 round figure.
On the flip side, momentum beyond the overnight swing high, around the $3,023 area, could push the Gold price to the $3,055-3,056 barrier. Some follow-through buying should pave the way for a move towards reclaiming the $3,100 mark, with some intermediate hurdle near the $3,075-3.080 region.
The table below shows the percentage change of US Dollar (USD) against listed major currencies today. US Dollar was the strongest against the New Zealand Dollar.
| USD | EUR | GBP | JPY | CAD | AUD | NZD | CHF | |
|---|---|---|---|---|---|---|---|---|
| USD | -0.66% | -0.47% | -0.77% | -0.15% | -0.14% | 0.20% | -0.52% | |
| EUR | 0.66% | 0.18% | -0.16% | 0.48% | 0.58% | 0.85% | 0.12% | |
| GBP | 0.47% | -0.18% | -0.32% | 0.31% | 0.40% | 0.67% | -0.05% | |
| JPY | 0.77% | 0.16% | 0.32% | 0.61% | 0.73% | 0.99% | 0.26% | |
| CAD | 0.15% | -0.48% | -0.31% | -0.61% | 0.19% | 0.36% | -0.36% | |
| AUD | 0.14% | -0.58% | -0.40% | -0.73% | -0.19% | 0.27% | -0.45% | |
| NZD | -0.20% | -0.85% | -0.67% | -0.99% | -0.36% | -0.27% | -0.72% | |
| CHF | 0.52% | -0.12% | 0.05% | -0.26% | 0.36% | 0.45% | 0.72% |
The heat map shows percentage changes of major currencies against each other. The base currency is picked from the left column, while the quote currency is picked from the top row. For example, if you pick the US Dollar from the left column and move along the horizontal line to the Japanese Yen, the percentage change displayed in the box will represent USD (base)/JPY (quote).
![]()
Created
: 2025.04.09
![]()
Last updated
: 2025.04.09

FXStreet is a forex information website, delivering market analysis and news articles 24/7.
It features a number of articles contributed by well-known analysts, in addition to the ones by its editorial team.
Founded in 2000 by Francesc Riverola, a Spanish economist, it has grown to become a world-renowned information website.
We hope you find this article useful. Any comments or suggestions will be greatly appreciated.
We are also looking for writers with extensive experience in forex and crypto to join us.
please contact us at [email protected].
Disclaimer:![]()
All information and content provided on this website is provided for informational purposes only and is not intended to solicit any investment. Although all efforts are made in order to ensure that the information is correct, no guarantee is provided for the accuracy of any content on this website. Any decision made shall be the responsibility of the investor and Myforex does not take any responsibility whatsoever regarding the use of any information provided herein.
The content provided on this website belongs to Myforex and, where stated, the relevant licensors. All rights are reserved by Myforex and the relevant licensors, and no content of this website, whether in full or in part, shall be copied or displayed elsewhere without the explicit written permission of the relevant copyright holder. If you wish to use any part of the content provided on this website, please ensure that you contact Myforex.
Myforex uses cookies to improve the convenience and functionality of this website. This website may include cookies not only by us but also by third parties (advertisers, log analysts, etc.) for the purpose of tracking the activities of users. Cookie policy
