Created
: 2025.03.20


![]() 2025.03.20 07:56
2025.03.20 07:56
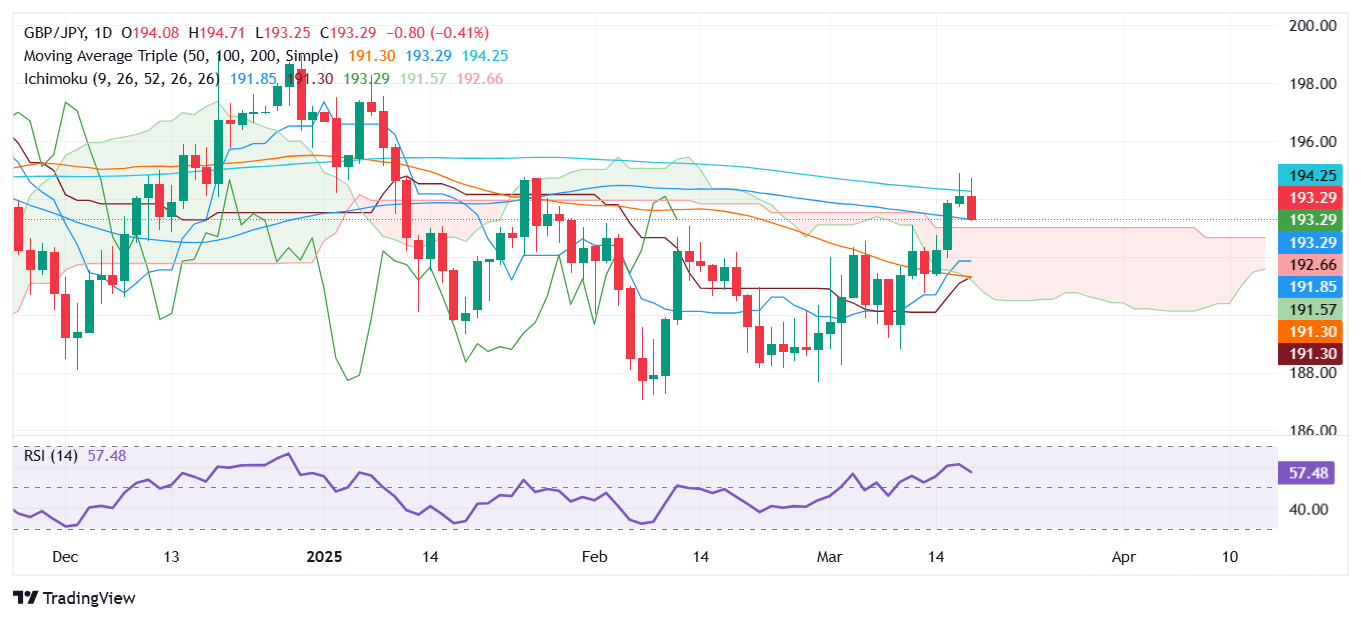
The GBP/JPY retreats after rallying for three straight trading days since last Friday. However, it struggled to clear the 195.00 figure and the 200-day Simple Moving Average (SMA), which exacerbated a drop in the cross pair beneath the 193.50 area. At the time of writing, the pair hovers near 193.28, virtually unchanged.
The GBP/JPY trades sideways for the second straight day, capped on the downside by the 100-day Simple Moving Average (SMA) at 193.23 and the Senkou Span B near 192.28. On the top side, the 200-day SMA at 194.18 would likely keep the pair trading range bound.
Additionally, despite being bullish, the Relative Strength Index (RSI) is flat. Hence, buyers and sellers lack the strength to break the trading range.
If GBP/JPY falls below 192.28, the next support would be the Tenkan-sen at 191.83, followed by the Kijun-sen at 191.24. Conversely, if GBP/JPY climbs past the 200-day SMA, the next resistance would be the March 18 peak at 194.89, ahead of 195.00.
The table below shows the percentage change of British Pound (GBP) against listed major currencies this week. British Pound was the strongest against the US Dollar.
| USD | EUR | GBP | JPY | CAD | AUD | NZD | CHF | |
|---|---|---|---|---|---|---|---|---|
| USD | -0.28% | -0.54% | -0.10% | -0.44% | -0.46% | -1.27% | -0.94% | |
| EUR | 0.28% | -0.38% | -0.21% | -0.15% | -0.31% | -1.00% | -0.68% | |
| GBP | 0.54% | 0.38% | 0.48% | 0.02% | 0.05% | -0.63% | -0.37% | |
| JPY | 0.10% | 0.21% | -0.48% | -0.34% | -0.56% | -1.12% | -0.96% | |
| CAD | 0.44% | 0.15% | -0.02% | 0.34% | -0.20% | -0.82% | -1.05% | |
| AUD | 0.46% | 0.31% | -0.05% | 0.56% | 0.20% | -0.67% | -0.35% | |
| NZD | 1.27% | 1.00% | 0.63% | 1.12% | 0.82% | 0.67% | 0.32% | |
| CHF | 0.94% | 0.68% | 0.37% | 0.96% | 1.05% | 0.35% | -0.32% |
The heat map shows percentage changes of major currencies against each other. The base currency is picked from the left column, while the quote currency is picked from the top row. For example, if you pick the British Pound from the left column and move along the horizontal line to the US Dollar, the percentage change displayed in the box will represent GBP (base)/USD (quote).
![]()
Created
: 2025.03.20
![]()
Last updated
: 2025.03.20

FXStreet is a forex information website, delivering market analysis and news articles 24/7.
It features a number of articles contributed by well-known analysts, in addition to the ones by its editorial team.
Founded in 2000 by Francesc Riverola, a Spanish economist, it has grown to become a world-renowned information website.
We hope you find this article useful. Any comments or suggestions will be greatly appreciated.
We are also looking for writers with extensive experience in forex and crypto to join us.
please contact us at [email protected].
Disclaimer:![]()
All information and content provided on this website is provided for informational purposes only and is not intended to solicit any investment. Although all efforts are made in order to ensure that the information is correct, no guarantee is provided for the accuracy of any content on this website. Any decision made shall be the responsibility of the investor and Myforex does not take any responsibility whatsoever regarding the use of any information provided herein.
The content provided on this website belongs to Myforex and, where stated, the relevant licensors. All rights are reserved by Myforex and the relevant licensors, and no content of this website, whether in full or in part, shall be copied or displayed elsewhere without the explicit written permission of the relevant copyright holder. If you wish to use any part of the content provided on this website, please ensure that you contact Myforex.
Myforex uses cookies to improve the convenience and functionality of this website. This website may include cookies not only by us but also by third parties (advertisers, log analysts, etc.) for the purpose of tracking the activities of users. Cookie policy
