Created
: 2025.03.19


![]() 2025.03.19 03:37
2025.03.19 03:37
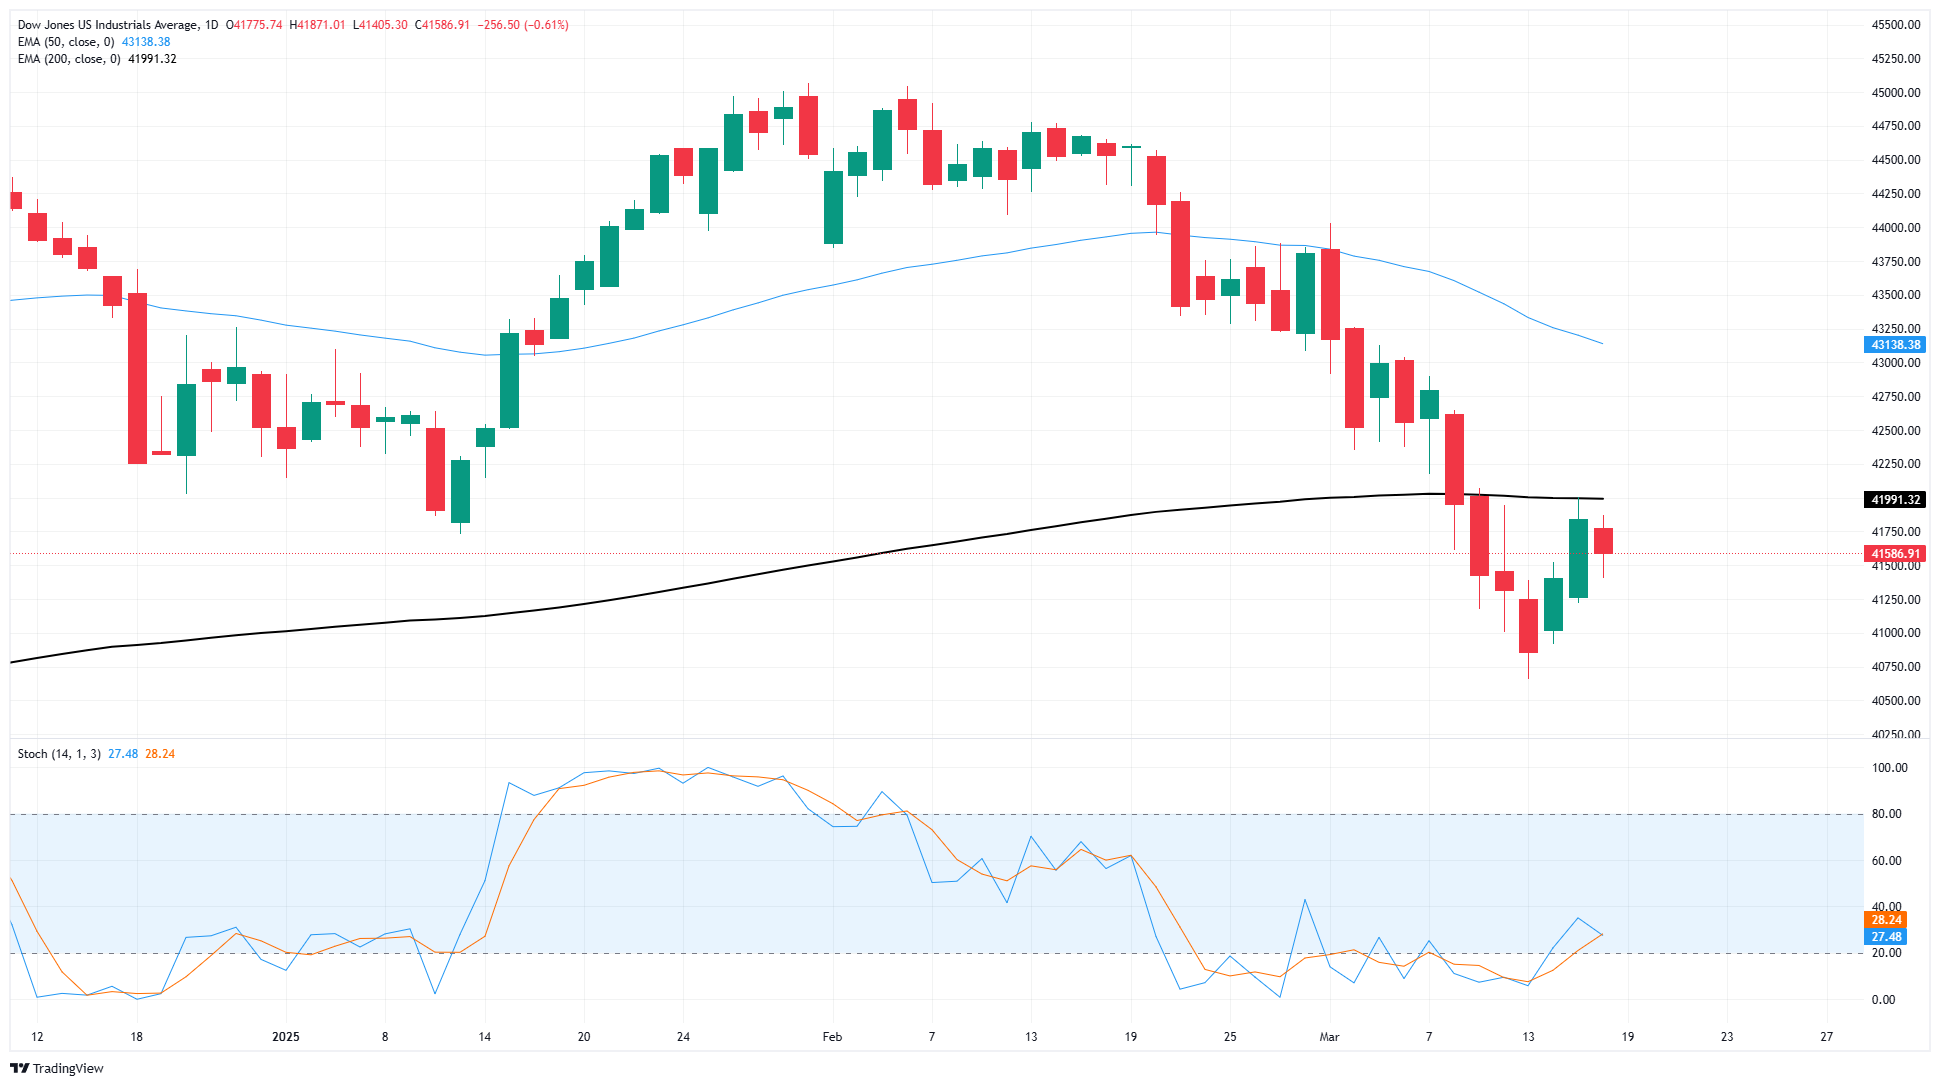
The Dow Jones Industrial Average (DJIA) pulled back around 300 points on Wednesday, snapping a two-day win streak and pushing back into the low side as equities remain unable to find a consistent reason to pivot confidently out of a recent downturn sparked by ongoing geopolitical turmoil pouring out of the White House since Donald Trump took office as President in January.
Both the Dow Jones and the Standard and Poor's 500 (S&P) are back into the red on Tuesday. The Dow eased back below the 42,000 level, and the S&P 500 continues to toy with the 5,600 handle. Both major equity indexes are testing correction territory, down around 8% from record highs.
The Trump team's plans for further tariffs slated to come into effect on April 2nd are once again shifting. President Donald Trump has asked his Treasury Secretary Scott Bessent to "rethink" the US sanctions regime. Fresh tariff talk has knocked the latest bull run flat on its back, despite Treasury Secretary Bessent hinting that tariffs may not be as across-the-board as originally envisioned. Given the Trump administration's general anathema for consistent policy disclosure, this will hardly come as a surprise to markets that have grown accustomed to near-constant waffling, capitulation, and last-minute changes to the majority of team Trump's trade policy proposals over the past eight weeks.
The Federal Reserve's (Fed) latest rate call is due on Wednesday. According to the CME's FedWatch Tool, rate markets broadly anticipate the Fed to stand pat on rates for the next two meetings, with the next quarter-point rate trim expected at the Federal Open Market Committee's (FOMC) June meeting. However, the FOMC's latest interest rate forecasts will be released this week. They could send rate cut expectations through the wringer if Fed policymaker's expectations for interest rates deviate wildly from current market forecasts.
Stock sectors are red across the board on Tuesday as investors struggle to find a place to hide. Despite announcing a partnership to help develop processes to produce a fleet of self-driving cars, Nvidia (NVDA) and General Motors (GM) are both falling back. Nvidia is down 2.5% near $116 per share and GM is down around 1%, testing below $50 per share as it gets more difficult to spark buying interest in investors simply by announcing more AI projects.
With a fresh bearish daily candlestick, the Dow Jones is at risk of chalking in a technical rejection from the 200-day Exponential Moving Average (EMA) near the 42,000 major price handle. Buyers are suddenly running out of time to push bids back into the high end.
The Dow Jones Industrial Average, one of the oldest stock market indices in the world, is compiled of the 30 most traded stocks in the US. The index is price-weighted rather than weighted by capitalization. It is calculated by summing the prices of the constituent stocks and dividing them by a factor, currently 0.152. The index was founded by Charles Dow, who also founded the Wall Street Journal. In later years it has been criticized for not being broadly representative enough because it only tracks 30 conglomerates, unlike broader indices such as the S&P 500.
Many different factors drive the Dow Jones Industrial Average (DJIA). The aggregate performance of the component companies revealed in quarterly company earnings reports is the main one. US and global macroeconomic data also contributes as it impacts on investor sentiment. The level of interest rates, set by the Federal Reserve (Fed), also influences the DJIA as it affects the cost of credit, on which many corporations are heavily reliant. Therefore, inflation can be a major driver as well as other metrics which impact the Fed decisions.
Dow Theory is a method for identifying the primary trend of the stock market developed by Charles Dow. A key step is to compare the direction of the Dow Jones Industrial Average (DJIA) and the Dow Jones Transportation Average (DJTA) and only follow trends where both are moving in the same direction. Volume is a confirmatory criteria. The theory uses elements of peak and trough analysis. Dow's theory posits three trend phases: accumulation, when smart money starts buying or selling; public participation, when the wider public joins in; and distribution, when the smart money exits.
There are a number of ways to trade the DJIA. One is to use ETFs which allow investors to trade the DJIA as a single security, rather than having to buy shares in all 30 constituent companies. A leading example is the SPDR Dow Jones Industrial Average ETF (DIA). DJIA futures contracts enable traders to speculate on the future value of the index and Options provide the right, but not the obligation, to buy or sell the index at a predetermined price in the future. Mutual funds enable investors to buy a share of a diversified portfolio of DJIA stocks thus providing exposure to the overall index.
![]()
Created
: 2025.03.19
![]()
Last updated
: 2025.03.19

FXStreet is a forex information website, delivering market analysis and news articles 24/7.
It features a number of articles contributed by well-known analysts, in addition to the ones by its editorial team.
Founded in 2000 by Francesc Riverola, a Spanish economist, it has grown to become a world-renowned information website.
We hope you find this article useful. Any comments or suggestions will be greatly appreciated.
We are also looking for writers with extensive experience in forex and crypto to join us.
please contact us at [email protected].
Disclaimer:![]()
All information and content provided on this website is provided for informational purposes only and is not intended to solicit any investment. Although all efforts are made in order to ensure that the information is correct, no guarantee is provided for the accuracy of any content on this website. Any decision made shall be the responsibility of the investor and Myforex does not take any responsibility whatsoever regarding the use of any information provided herein.
The content provided on this website belongs to Myforex and, where stated, the relevant licensors. All rights are reserved by Myforex and the relevant licensors, and no content of this website, whether in full or in part, shall be copied or displayed elsewhere without the explicit written permission of the relevant copyright holder. If you wish to use any part of the content provided on this website, please ensure that you contact Myforex.
Myforex uses cookies to improve the convenience and functionality of this website. This website may include cookies not only by us but also by third parties (advertisers, log analysts, etc.) for the purpose of tracking the activities of users. Cookie policy
