Created
: 2025.03.12


![]() 2025.03.12 01:43
2025.03.12 01:43
The Dow Jones Industrial Average (DJIA) shed further weight on Tuesday, dropping nearly 700 points on the day, or 1.76% after United States (US) President Donald Trump vowed to heat up his own trade war with Canada. President Trump took to his Truth Social account early Tuesday, informing his social media followers that he's instructed his Secretary of Commerce to impose an additional 25% tariff on all Canadian steel and aluminum exports to the US, bringing the new total to 50% on all Canadian metals. The new tariffs are, in theory, slated to go into effect on Wednesday morning.
Donald Trump remains deeply unsatisfied with the conditions of US dairy trade with Canada as outlined in his own bespoke USMCA trade agreement that came out of NAFTA renegotiations that Trump demanded during his first term as US President. Under USMCA, Canada allows a certain amount of US dairy across its borders entirely tariff-free, then imposes steep trade fees to clamp down on dairy imports to prevent US economic dumping. President Trump appears to be entirely unsatisfied with the terms of his own bespoke trade agreement, declaring via social media that his steep Canadian metals tariffs won't be rescinded until Canada arbitrarily chooses to violate the terms set out for it under the USMCA and drops all cap-trade tariffs on US dairy products entirely.
US JOLTS Job Openings data came in slightly stronger than expected, helping to provide some stability for otherwise rattled markets. Job postings increased to 7.74M in January, climbing above the expected print of 7.63M and rising from December's 7.508M, which was revised slightly lower from 7.6M.
Most of the securities listed on the Dow Jones are printing in the red on Tuesday as markets grapple with the latest iteration of Trump's self-styled trade war with some of the US's closest trading partners. Salesforce (CRM) rebounded 1.9% to $278 per share, and Nvidia (NVDA) rose 1.7% to $109 per share as tech darlings pare recent losses amid the cooling AI tech rally.
On the low side, Verizon (VZ) tumbled around 7% to $43 per share, falling after guidance from a Verizon Communications wireless executive warned that new customer additions would likely come in "soft" during the current quarter. Disney (DIS) fell 4.4% to $98.50 per share, and Apple (AAPL) also declined 3.5% to fall below $220 per share as trade war fears ramp up.
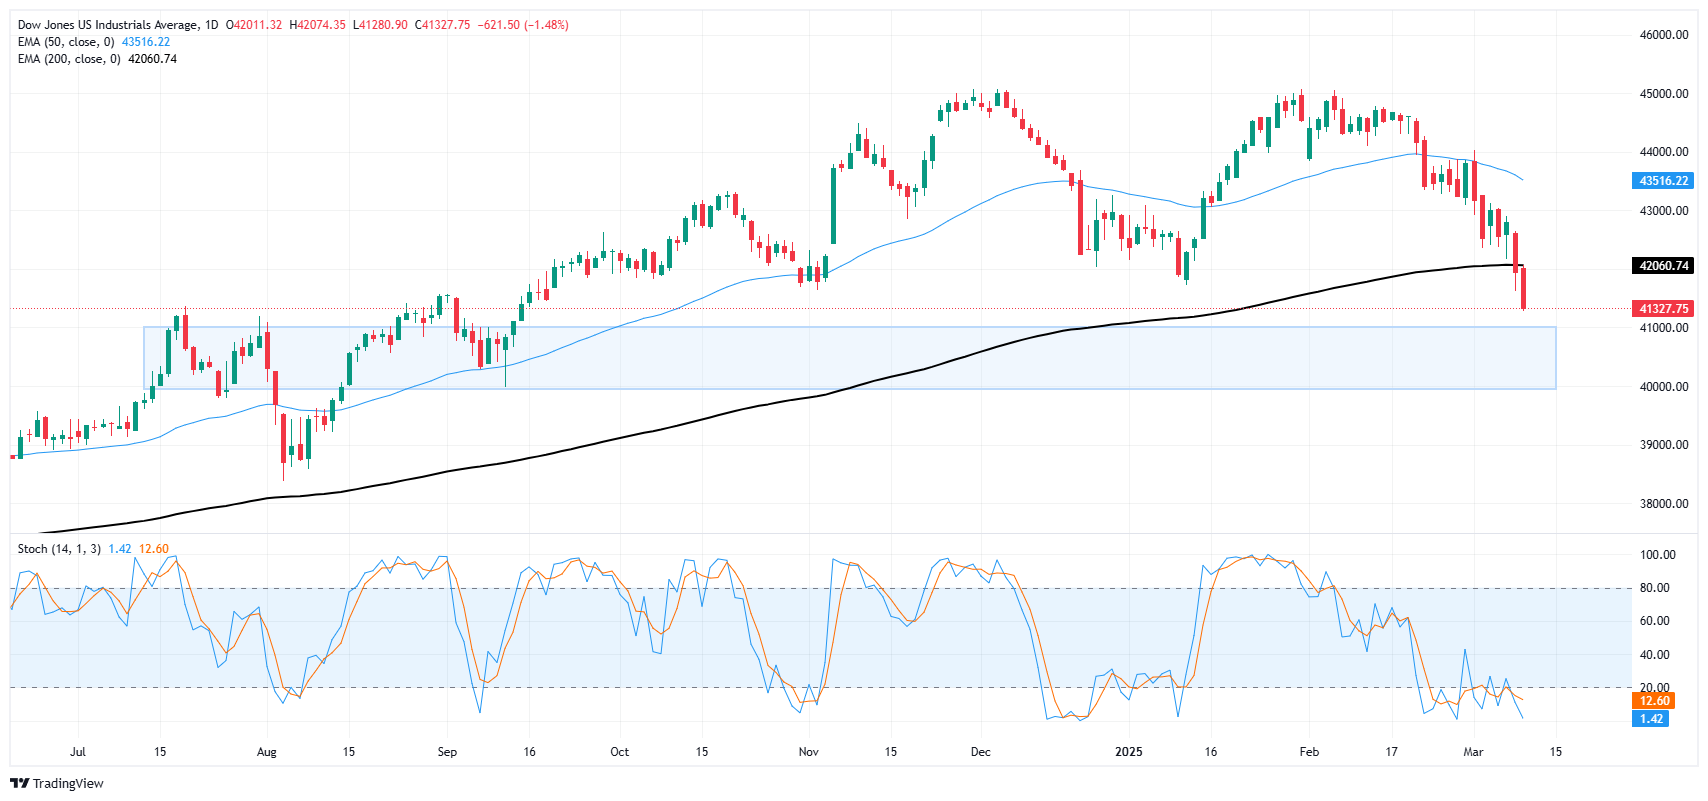
Now that the seal is finally broken and the Dow Jones has pierced the 200-day Exponential Moving Average (EMA) near the 42,000 key price handle for the first time in over two years, bearish momentum is continuing to drag price action even lower. The Dow Jones Industrial Average is trading at its lowest prices in nearly 26-weeks as the majority equity index tips over into bullish correction territory.
The Dow Jones is down 8.4% from record highs set last November just north of 45,000 as the current bear run heats up. Still, bullish pressure is beginning to cook as technical oscillators pin even deeper into oversold territory, flashing warnings of a topside correction. A supply zone between the 41,000 and 40,000 major price handles could provide a convenient landing zone for bears before the Dow recovers its footing for a fresh push higher.
The Dow Jones Industrial Average, one of the oldest stock market indices in the world, is compiled of the 30 most traded stocks in the US. The index is price-weighted rather than weighted by capitalization. It is calculated by summing the prices of the constituent stocks and dividing them by a factor, currently 0.152. The index was founded by Charles Dow, who also founded the Wall Street Journal. In later years it has been criticized for not being broadly representative enough because it only tracks 30 conglomerates, unlike broader indices such as the S&P 500.
Many different factors drive the Dow Jones Industrial Average (DJIA). The aggregate performance of the component companies revealed in quarterly company earnings reports is the main one. US and global macroeconomic data also contributes as it impacts on investor sentiment. The level of interest rates, set by the Federal Reserve (Fed), also influences the DJIA as it affects the cost of credit, on which many corporations are heavily reliant. Therefore, inflation can be a major driver as well as other metrics which impact the Fed decisions.
Dow Theory is a method for identifying the primary trend of the stock market developed by Charles Dow. A key step is to compare the direction of the Dow Jones Industrial Average (DJIA) and the Dow Jones Transportation Average (DJTA) and only follow trends where both are moving in the same direction. Volume is a confirmatory criteria. The theory uses elements of peak and trough analysis. Dow's theory posits three trend phases: accumulation, when smart money starts buying or selling; public participation, when the wider public joins in; and distribution, when the smart money exits.
There are a number of ways to trade the DJIA. One is to use ETFs which allow investors to trade the DJIA as a single security, rather than having to buy shares in all 30 constituent companies. A leading example is the SPDR Dow Jones Industrial Average ETF (DIA). DJIA futures contracts enable traders to speculate on the future value of the index and Options provide the right, but not the obligation, to buy or sell the index at a predetermined price in the future. Mutual funds enable investors to buy a share of a diversified portfolio of DJIA stocks thus providing exposure to the overall index.
![]()
Created
: 2025.03.12
![]()
Last updated
: 2025.03.12

FXStreet is a forex information website, delivering market analysis and news articles 24/7.
It features a number of articles contributed by well-known analysts, in addition to the ones by its editorial team.
Founded in 2000 by Francesc Riverola, a Spanish economist, it has grown to become a world-renowned information website.
We hope you find this article useful. Any comments or suggestions will be greatly appreciated.
We are also looking for writers with extensive experience in forex and crypto to join us.
please contact us at [email protected].
Disclaimer:![]()
All information and content provided on this website is provided for informational purposes only and is not intended to solicit any investment. Although all efforts are made in order to ensure that the information is correct, no guarantee is provided for the accuracy of any content on this website. Any decision made shall be the responsibility of the investor and Myforex does not take any responsibility whatsoever regarding the use of any information provided herein.
The content provided on this website belongs to Myforex and, where stated, the relevant licensors. All rights are reserved by Myforex and the relevant licensors, and no content of this website, whether in full or in part, shall be copied or displayed elsewhere without the explicit written permission of the relevant copyright holder. If you wish to use any part of the content provided on this website, please ensure that you contact Myforex.
Myforex uses cookies to improve the convenience and functionality of this website. This website may include cookies not only by us but also by third parties (advertisers, log analysts, etc.) for the purpose of tracking the activities of users. Cookie policy
