Created
: 2025.02.07


![]() 2025.02.07 14:12
2025.02.07 14:12
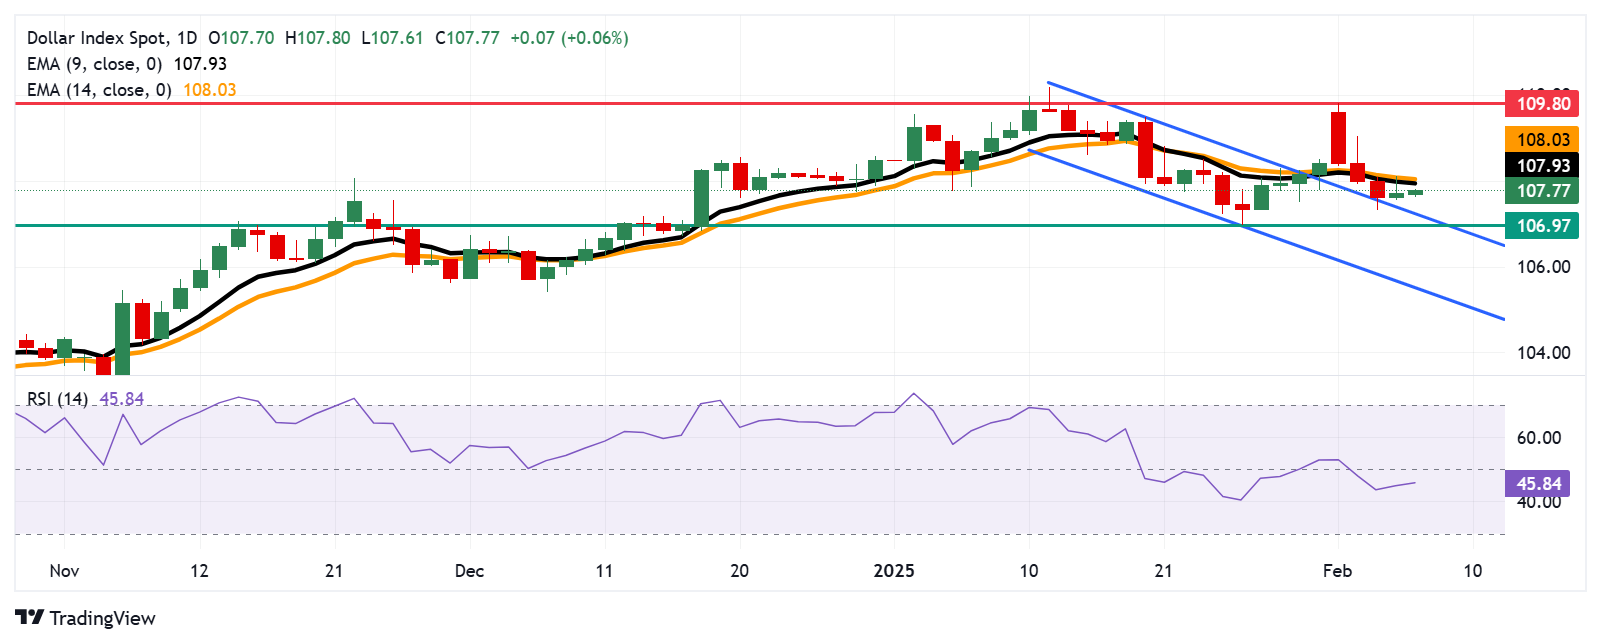
The US Dollar Index (DXY) continues its upward momentum for the second consecutive day, trading around 107.80 during Asian hours on Friday. A review of the daily chart suggests a weakening bearish bias as the index consolidates above the descending channel pattern.
The 14-day Relative Strength Index (RSI) remains just below the 50 level, indicating that bearish sentiment is still present. A decisive move above the 50 mark would confirm a shift from a bearish to a bullish bias. Furthermore, the US Dollar Index remains below its nine- and 14-day Exponential Moving Averages (EMAs), signaling weaker short-term price momentum.
On the downside, the upper boundary of the descending channel serves as the key support near 107.30, followed by the two-month low of 106.97, which was recorded on January 27. A drop below the latter could strengthen the bearish bias, pushing the index toward the lower boundary of the descending channel at 105.60.
Regarding resistance, the DXY may first challenge the nine-day EMA at 107.94, followed by the 14-day EMA at 108.03. A breakout above these levels could enhance short-term price momentum, potentially driving the index toward its three-week high of 109.80, last tested on February 3.
The table below shows the percentage change of US Dollar (USD) against listed major currencies today. US Dollar was the strongest against the Swiss Franc.
| USD | EUR | GBP | JPY | CAD | AUD | NZD | CHF | |
|---|---|---|---|---|---|---|---|---|
| USD | 0.08% | 0.12% | 0.12% | 0.11% | 0.02% | -0.02% | 0.16% | |
| EUR | -0.08% | 0.04% | 0.02% | 0.04% | -0.05% | -0.10% | 0.08% | |
| GBP | -0.12% | -0.04% | -0.02% | -0.01% | -0.10% | -0.13% | 0.04% | |
| JPY | -0.12% | -0.02% | 0.02% | -0.01% | -0.10% | -0.16% | 0.03% | |
| CAD | -0.11% | -0.04% | 0.01% | 0.01% | -0.10% | -0.13% | 0.05% | |
| AUD | -0.02% | 0.05% | 0.10% | 0.10% | 0.10% | -0.04% | 0.14% | |
| NZD | 0.02% | 0.10% | 0.13% | 0.16% | 0.13% | 0.04% | 0.18% | |
| CHF | -0.16% | -0.08% | -0.04% | -0.03% | -0.05% | -0.14% | -0.18% |
The heat map shows percentage changes of major currencies against each other. The base currency is picked from the left column, while the quote currency is picked from the top row. For example, if you pick the US Dollar from the left column and move along the horizontal line to the Japanese Yen, the percentage change displayed in the box will represent USD (base)/JPY (quote).
![]()
Created
: 2025.02.07
![]()
Last updated
: 2025.02.07

FXStreet is a forex information website, delivering market analysis and news articles 24/7.
It features a number of articles contributed by well-known analysts, in addition to the ones by its editorial team.
Founded in 2000 by Francesc Riverola, a Spanish economist, it has grown to become a world-renowned information website.
We hope you find this article useful. Any comments or suggestions will be greatly appreciated.
We are also looking for writers with extensive experience in forex and crypto to join us.
please contact us at [email protected].
Disclaimer:![]()
All information and content provided on this website is provided for informational purposes only and is not intended to solicit any investment. Although all efforts are made in order to ensure that the information is correct, no guarantee is provided for the accuracy of any content on this website. Any decision made shall be the responsibility of the investor and Myforex does not take any responsibility whatsoever regarding the use of any information provided herein.
The content provided on this website belongs to Myforex and, where stated, the relevant licensors. All rights are reserved by Myforex and the relevant licensors, and no content of this website, whether in full or in part, shall be copied or displayed elsewhere without the explicit written permission of the relevant copyright holder. If you wish to use any part of the content provided on this website, please ensure that you contact Myforex.
Myforex uses cookies to improve the convenience and functionality of this website. This website may include cookies not only by us but also by third parties (advertisers, log analysts, etc.) for the purpose of tracking the activities of users. Cookie policy
