Created
: 2024.10.21


![]() 2024.10.21 14:37
2024.10.21 14:37
The GBP/USD pair struggles to capitalize on a two-day-old recovery move from the 1.2975 area, or a nearly two-month trough touched last Thursday and kicks off the new week on a softer note. Spot prices currently trade just below mid-1.3000s and seem vulnerable to prolonging the recent pullback from the 1.3435 region, or the highest level since March 2022.
The US Dollar (USD) attracts some dip-buyers at the start of a new week and reverses a part of Friday's losses amid expectations that the Federal Reserve (Fed) will proceed with modest rate cuts over the next year. The British Pound (GBP), on the other hand, is undermined by rising bets for interest rate cuts by the Bank of England (BoE) in November and December. This, in turn, adds credence to the near-term negative outlook for the GBP/USD pair.
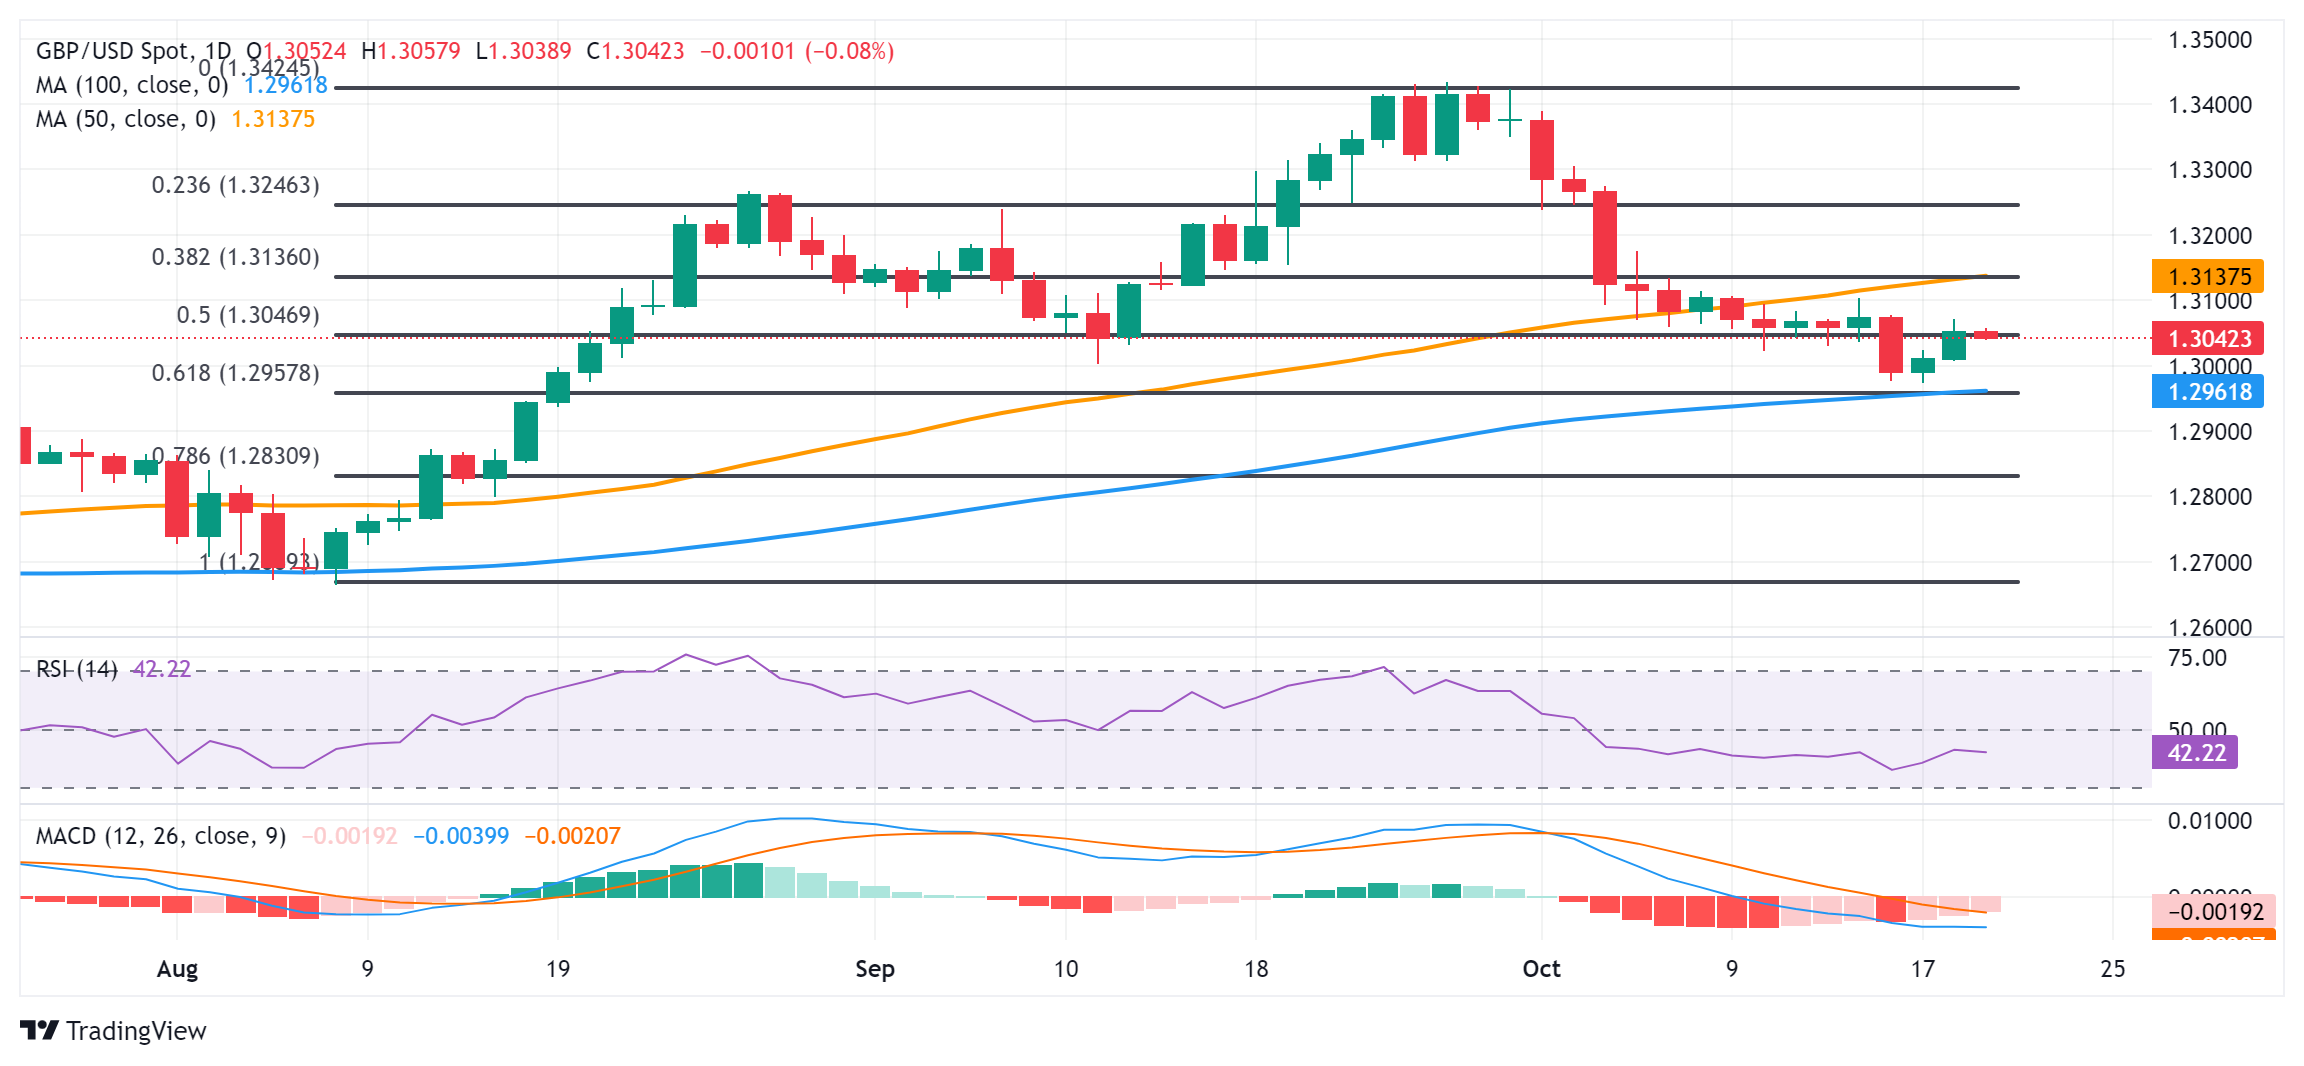
From a technical perspective, the recent breakdown through the 50-day Simple Moving Average (SMA) and the subsequent fall below the 50% Fibonacci retracement level of the August-September upswing was seen as a fresh trigger for bears. Furthermore, oscillators on the daily chart are holding in negative territory and are still away from being in the oversold territory, suggesting that the path of least resistance for the GBP/USD pair is to the downside.
Hence, some follow-through weakness back below the 1.3000 psychological mark, towards testing the 1.2960-1.2955 confluence support, looks like a distinct possibility. The latter comprises the 100-day SMA and the 61.8% Fibo. level, which if broken should pave the way for a slide towards the 1.2900 round figure en route to the 1.2860 horizontal support.
On the flip side, attempted recovery beyond the 1.3100 mark is likely to confront resistance near the 1.3135 region, or the 38.2% Fibo. level. The said hurdle now coincides with the 50-day SMA and should act as a key pivotal point. A sustained strength beyond might shift the bias in favor of bullish traders and allow the GBP/USD pair to reclaim the 1.3200 mark. The move up could extend further towards the 1.3250 strong horizontal support breakpoint.
The table below shows the percentage change of US Dollar (USD) against listed major currencies today. US Dollar was the strongest against the Australian Dollar.
| USD | EUR | GBP | JPY | CAD | AUD | NZD | CHF | |
|---|---|---|---|---|---|---|---|---|
| USD | 0.05% | 0.08% | -0.16% | -0.01% | 0.14% | -0.02% | 0.08% | |
| EUR | -0.05% | -0.04% | -0.28% | -0.01% | 0.05% | -0.19% | -0.05% | |
| GBP | -0.08% | 0.04% | -0.23% | -0.09% | 0.07% | -0.11% | -0.05% | |
| JPY | 0.16% | 0.28% | 0.23% | 0.14% | 0.30% | 0.18% | 0.18% | |
| CAD | 0.01% | 0.00% | 0.09% | -0.14% | 0.06% | 0.05% | -0.04% | |
| AUD | -0.14% | -0.05% | -0.07% | -0.30% | -0.06% | -0.09% | -0.14% | |
| NZD | 0.02% | 0.19% | 0.11% | -0.18% | -0.05% | 0.09% | 0.05% | |
| CHF | -0.08% | 0.05% | 0.05% | -0.18% | 0.04% | 0.14% | -0.05% |
The heat map shows percentage changes of major currencies against each other. The base currency is picked from the left column, while the quote currency is picked from the top row. For example, if you pick the US Dollar from the left column and move along the horizontal line to the Japanese Yen, the percentage change displayed in the box will represent USD (base)/JPY (quote).
![]()
Created
: 2024.10.21
![]()
Last updated
: 2024.10.21

FXStreet is a forex information website, delivering market analysis and news articles 24/7.
It features a number of articles contributed by well-known analysts, in addition to the ones by its editorial team.
Founded in 2000 by Francesc Riverola, a Spanish economist, it has grown to become a world-renowned information website.
We hope you find this article useful. Any comments or suggestions will be greatly appreciated.
We are also looking for writers with extensive experience in forex and crypto to join us.
please contact us at [email protected].
Disclaimer:![]()
All information and content provided on this website is provided for informational purposes only and is not intended to solicit any investment. Although all efforts are made in order to ensure that the information is correct, no guarantee is provided for the accuracy of any content on this website. Any decision made shall be the responsibility of the investor and Myforex does not take any responsibility whatsoever regarding the use of any information provided herein.
The content provided on this website belongs to Myforex and, where stated, the relevant licensors. All rights are reserved by Myforex and the relevant licensors, and no content of this website, whether in full or in part, shall be copied or displayed elsewhere without the explicit written permission of the relevant copyright holder. If you wish to use any part of the content provided on this website, please ensure that you contact Myforex.
Myforex uses cookies to improve the convenience and functionality of this website. This website may include cookies not only by us but also by third parties (advertisers, log analysts, etc.) for the purpose of tracking the activities of users. Cookie policy
