Created
: 2024.10.03


![]() 2024.10.03 18:32
2024.10.03 18:32
Gold (XAU/USD) edges lower to trade in the $2,640s per troy ounce on Thursday as it continues its line dance below the record high of $2,685 set last week. Sellers have the edge over buyers as bets fade that the Federal Reserve (Fed) will continue slashing interest rates aggressively in the United States (US), which, in turn, takes the shine off non-interest-bearing assets like Gold.
The downside is limited, however, by support from two key factors: safe-haven flows into Gold due to the fear of an escalation of the conflict in the Middle East and the general trend lower in global interest rates - notwithstanding the Fed's newfound caution - which enables Gold to still retain its overall attractiveness to investors.
Gold continues to see upside capped by seesawing expectations regarding the future course of interest rates in the US. From the chances of the Fed cutting interest rates by another double-dose 50 basis points (0.50%) again in November, standing above 60% last week, these have now fallen to a much less certain level of around mid-30%.
The fall in market bets comes after the release of stronger-than-expected US jobs data, which suggests the US economy is not tilting on a cliff edge. This, in turn, has enabled the Dollar to resurface from its deep dive in August, providing a further headwind to Gold, which is mostly priced and traded in USD. Regarding the health of the US labor market, the release of the most important US employment report, the Nonfarm Payrolls (NFP), will be a critical deciding factor on Friday.
Gold enters a sideways market mode on the 4-hour chart (below) between the all-time high of $2,685 and a floor at around Monday's low of $2,625. The short-term trend is unclear and could now possibly be sideways. It would require a breakout either above the top of the range or below the bottom to confirm a new directional bias.
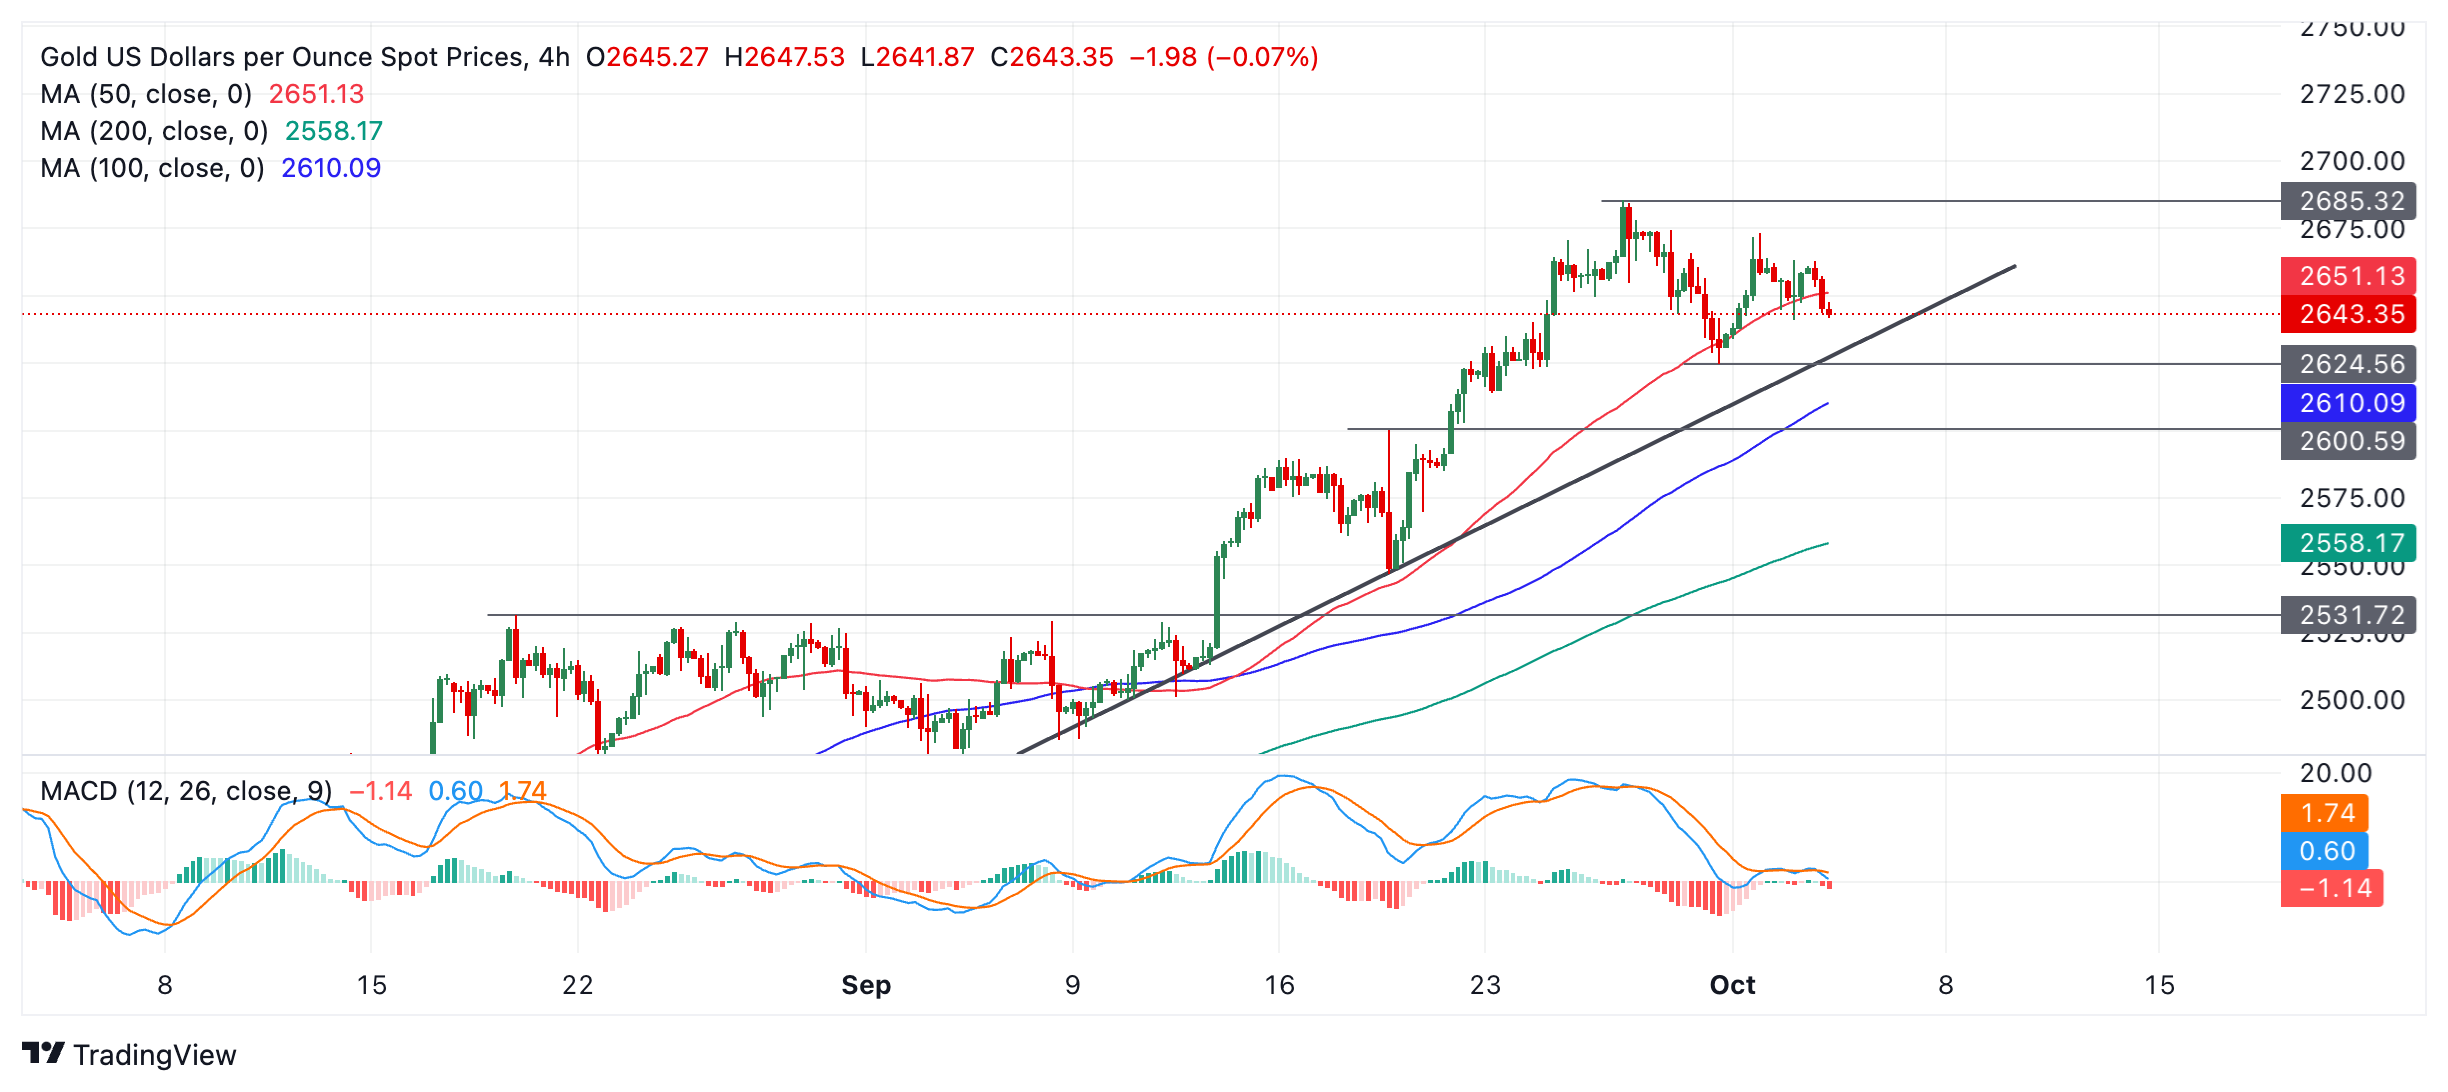
A break above the $2,673 Tuesday's high would, however, increase the odds of a resumption of the old uptrend, probably leading to a continuation up to the round-number target at $2,700.
Gold is attempting to pierce the red 50-period Simple Moving Average (SMA) on the chart above, however, which suggests building downside pressure.
If a break through the SMA ensues, it will probably take prices down to support from the trendline at $2,630. A break below the $2,625 swing low would likely see prices give way to support at $2,600 (August 20 high, round number).
On a medium and long-term basis, Gold remains in an uptrend and, since it is a foundational principle of technical analysis that "the trend is your friend," the odds favor resumption higher eventually once the current period of consolidation has ended.
The Nonfarm Payrolls release presents the number of new jobs created in the US during the previous month in all non-agricultural businesses; it is released by the US Bureau of Labor Statistics (BLS). The monthly changes in payrolls can be extremely volatile. The number is also subject to strong reviews, which can also trigger volatility in the Forex board. Generally speaking, a high reading is seen as bullish for the US Dollar (USD), while a low reading is seen as bearish, although previous months' reviews and the Unemployment Rate are as relevant as the headline figure. The market's reaction, therefore, depends on how the market assesses all the data contained in the BLS report as a whole.
Read more.Next release: Fri Oct 04, 2024 12:30
Frequency: Monthly
Consensus: 140K
Previous: 142K
Source: US Bureau of Labor Statistics
America's monthly jobs report is considered the most important economic indicator for forex traders. Released on the first Friday following the reported month, the change in the number of positions is closely correlated with the overall performance of the economy and is monitored by policymakers. Full employment is one of the Federal Reserve's mandates and it considers developments in the labor market when setting its policies, thus impacting currencies. Despite several leading indicators shaping estimates, Nonfarm Payrolls tend to surprise markets and trigger substantial volatility. Actual figures beating the consensus tend to be USD bullish.
![]()
Created
: 2024.10.03
![]()
Last updated
: 2024.10.03

FXStreet is a forex information website, delivering market analysis and news articles 24/7.
It features a number of articles contributed by well-known analysts, in addition to the ones by its editorial team.
Founded in 2000 by Francesc Riverola, a Spanish economist, it has grown to become a world-renowned information website.
We hope you find this article useful. Any comments or suggestions will be greatly appreciated.
We are also looking for writers with extensive experience in forex and crypto to join us.
please contact us at [email protected].
Disclaimer:![]()
All information and content provided on this website is provided for informational purposes only and is not intended to solicit any investment. Although all efforts are made in order to ensure that the information is correct, no guarantee is provided for the accuracy of any content on this website. Any decision made shall be the responsibility of the investor and Myforex does not take any responsibility whatsoever regarding the use of any information provided herein.
The content provided on this website belongs to Myforex and, where stated, the relevant licensors. All rights are reserved by Myforex and the relevant licensors, and no content of this website, whether in full or in part, shall be copied or displayed elsewhere without the explicit written permission of the relevant copyright holder. If you wish to use any part of the content provided on this website, please ensure that you contact Myforex.
Myforex uses cookies to improve the convenience and functionality of this website. This website may include cookies not only by us but also by third parties (advertisers, log analysts, etc.) for the purpose of tracking the activities of users. Cookie policy
