Created
: 2024.09.24


![]() 2024.09.24 01:50
2024.09.24 01:50
The Dow Jones Industrial Average (DJIA) tested into a fresh record bid on Monday, but middling US data prints and cautious Fedspeak early in the day have kept risk appetite restrained. S&P US Purchasing Managers Index (PMI) figures printed on both sides of median market forecasts, and Federal Reserve (Fed) Bank of Chicago President Austan Goolsbee warned that despite the Fed's extra-wide initial rate cut this month, further moves on the Fed's reference rate could be needed over the next year to head off a potential deterioration of the US labor market.
September's S&P US Manufacturing PMI declined to 47.0 MoM, falling to its lowest level since July of 2023 as the US manufacturing sector sees a continued gloomy outlook on business activity. On the other hand, the S&P US Services PMI eased to 55.4 in September, down from August's 55.7 but beating the expected print of 55.2.
Fed policymaker and Chicago Fed President Austan Goolsbee hit markets with cooling comments early Monday, noting that much further movement on rates from the Fed could be necessary. The Fed official highlighted that the Fed may need to shoot much lower on policy rates in order to keep business lending conditions sufficiently liquid enough to keep the US business landscape keel-side down as record tightness in the US labor market drains away.
The S&P Global Manufacturing Purchasing Managers Index (PMI), released on a monthly basis, is a leading indicator gauging business activity in the US manufacturing sector. The data is derived from surveys of senior executives at private-sector companies from the manufacturing sector. Survey responses reflect the change, if any, in the current month compared to the previous month and can anticipate changing trends in official data series such as Gross Domestic Product (GDP), industrial production, employment and inflation. A reading above 50 indicates that the manufacturing economy is generally expanding, a bullish sign for the US Dollar (USD). Meanwhile, a reading below 50 signals that activity in the manufacturing sector is generally declining, which is seen as bearish for USD.
Read more.Last release: Mon Sep 23, 2024 13:45 (Prel)
Frequency: Monthly
Actual: 47
Consensus: 48.5
Previous: 47.9
Source: S&P Global
Roughly half of the Dow Jones index tested the low side on Monday, forcing the equity board to middle on headline figures. Intel (INTC) rose nearly 3% early in the day after it was reported that Apollo Global Management has floated a $5 billion investment in Intel, which signaled that investors are growing confident that the chipmaker may be able to turn around their recent backslide. The investment exploration from (AGM) also helped to head off a possible acquisition bid from Intel's immediate competitor in the silicon space, Qualcomm, which recently looked into purchasing the entirety of Intel outright.
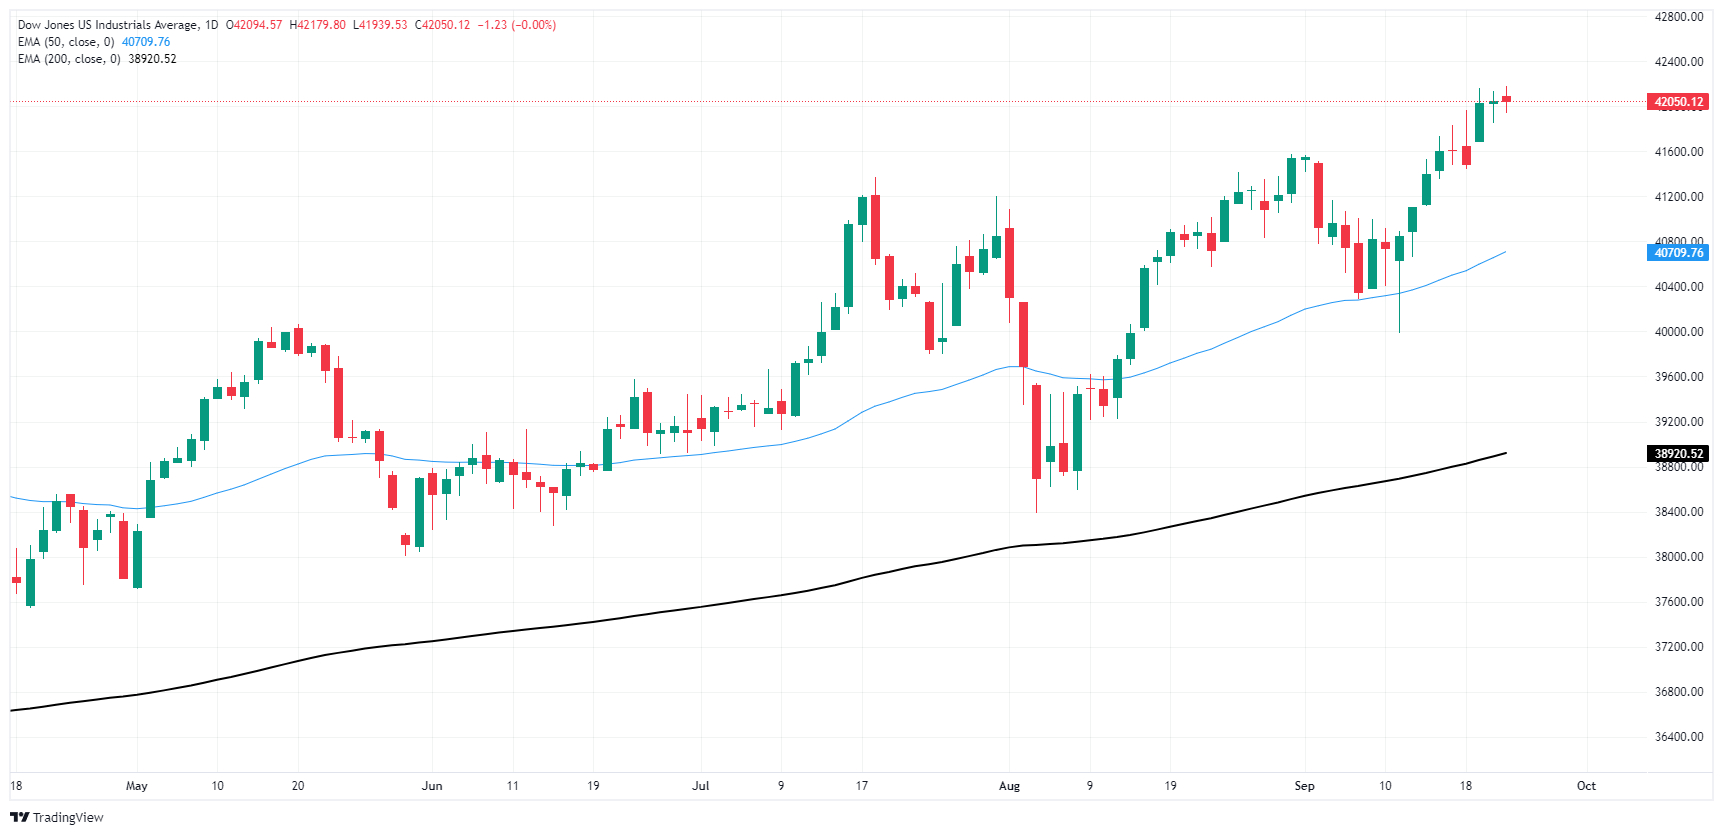
The Dow Jones continues to grind out chart paper near the 42,000 price handle despite a series of brief tests into all-time highs. The DJIA has rallied nearly 5.5% from the last swing low below 40,000 bottom-to-top, but near-term bullish momentum appears to be straining at the outer limits.
With bulls running out of technical levels to act as hard targets, the Dow Jones could be primed for a half-hearted bearish pullback with an immediate technical floor priced in near the 50-day Exponential Moving Average (EMA) rising from 40,700.
The Dow Jones Industrial Average, one of the oldest stock market indices in the world, is compiled of the 30 most traded stocks in the US. The index is price-weighted rather than weighted by capitalization. It is calculated by summing the prices of the constituent stocks and dividing them by a factor, currently 0.152. The index was founded by Charles Dow, who also founded the Wall Street Journal. In later years it has been criticized for not being broadly representative enough because it only tracks 30 conglomerates, unlike broader indices such as the S&P 500.
Many different factors drive the Dow Jones Industrial Average (DJIA). The aggregate performance of the component companies revealed in quarterly company earnings reports is the main one. US and global macroeconomic data also contributes as it impacts on investor sentiment. The level of interest rates, set by the Federal Reserve (Fed), also influences the DJIA as it affects the cost of credit, on which many corporations are heavily reliant. Therefore, inflation can be a major driver as well as other metrics which impact the Fed decisions.
Dow Theory is a method for identifying the primary trend of the stock market developed by Charles Dow. A key step is to compare the direction of the Dow Jones Industrial Average (DJIA) and the Dow Jones Transportation Average (DJTA) and only follow trends where both are moving in the same direction. Volume is a confirmatory criteria. The theory uses elements of peak and trough analysis. Dow's theory posits three trend phases: accumulation, when smart money starts buying or selling; public participation, when the wider public joins in; and distribution, when the smart money exits.
There are a number of ways to trade the DJIA. One is to use ETFs which allow investors to trade the DJIA as a single security, rather than having to buy shares in all 30 constituent companies. A leading example is the SPDR Dow Jones Industrial Average ETF (DIA). DJIA futures contracts enable traders to speculate on the future value of the index and Options provide the right, but not the obligation, to buy or sell the index at a predetermined price in the future. Mutual funds enable investors to buy a share of a diversified portfolio of DJIA stocks thus providing exposure to the overall index.
![]()
Created
: 2024.09.24
![]()
Last updated
: 2024.09.24

FXStreet is a forex information website, delivering market analysis and news articles 24/7.
It features a number of articles contributed by well-known analysts, in addition to the ones by its editorial team.
Founded in 2000 by Francesc Riverola, a Spanish economist, it has grown to become a world-renowned information website.
We hope you find this article useful. Any comments or suggestions will be greatly appreciated.
We are also looking for writers with extensive experience in forex and crypto to join us.
please contact us at [email protected].
Disclaimer:![]()
All information and content provided on this website is provided for informational purposes only and is not intended to solicit any investment. Although all efforts are made in order to ensure that the information is correct, no guarantee is provided for the accuracy of any content on this website. Any decision made shall be the responsibility of the investor and Myforex does not take any responsibility whatsoever regarding the use of any information provided herein.
The content provided on this website belongs to Myforex and, where stated, the relevant licensors. All rights are reserved by Myforex and the relevant licensors, and no content of this website, whether in full or in part, shall be copied or displayed elsewhere without the explicit written permission of the relevant copyright holder. If you wish to use any part of the content provided on this website, please ensure that you contact Myforex.
Myforex uses cookies to improve the convenience and functionality of this website. This website may include cookies not only by us but also by third parties (advertisers, log analysts, etc.) for the purpose of tracking the activities of users. Cookie policy
