Created
: 2024.09.09


![]() 2024.09.09 17:55
2024.09.09 17:55
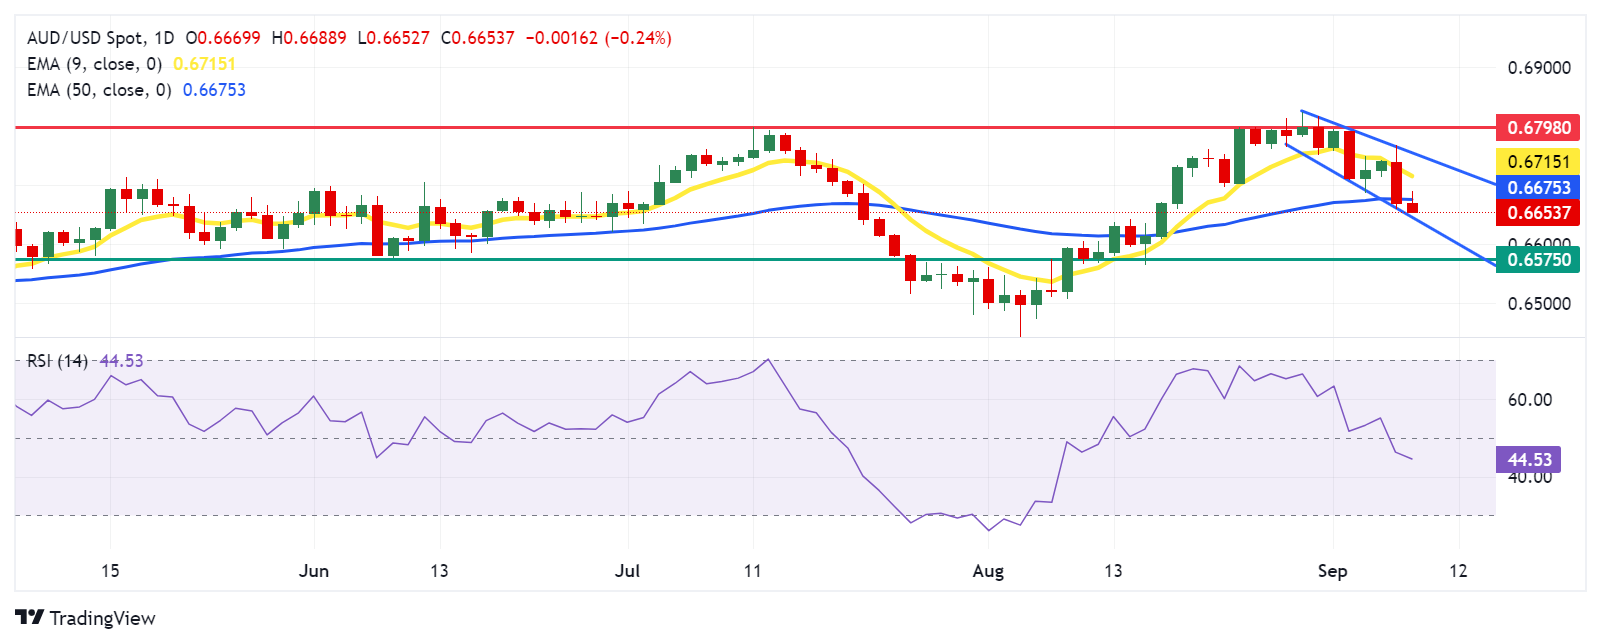
AUD/USD extends its losses for the second consecutive day, trading around 0.6650 during the European hours on Monday. The daily chart analysis shows that the pair is trekking down along the lower boundary of the descending channel, suggesting the reinforcing of a bearish bias.
Additionally, the 14-day Relative Strength Index (RSI) falls below the 50 level, confirming the ongoing bearish trend for the AUD/USD pair.
However, the daily chart analysis also indicates that the 9-day Exponential Moving Average (EMA) is positioned above the 50-day EMA, which is typically interpreted as a short-term bullish signal. This suggests that the recent price action is outperforming the longer-term trend.
On the downside, the AUD/USD pair targets the lower boundary of the descending channel around the level of 0.6440. A break below this level could strengthen the bearish bias and lead the pair to navigate the region around the throwback support at 0.6575.
In terms of resistance, the immediate barrier appears at the 50-day EMA at 0.6675 level, followed by the nine-day EMA at 0.6715 level. A breakthrough above the latter could weaken the bearish bias and support the AUD/USD pair to test the upper boundary of the descending channel around the 0.6750 level.
A breach above the descending channel could extend the upside and lead the pair to explore the region around its seven-month high of 0.6798, reached on July 11.
The table below shows the percentage change of Australian Dollar (AUD) against listed major currencies today. Australian Dollar was the weakest against the Canadian Dollar.
| USD | EUR | GBP | JPY | CAD | AUD | NZD | CHF | |
|---|---|---|---|---|---|---|---|---|
| USD | 0.32% | 0.32% | 0.79% | 0.03% | 0.23% | 0.65% | 0.43% | |
| EUR | -0.32% | -0.05% | 0.52% | -0.28% | -0.14% | 0.34% | 0.10% | |
| GBP | -0.32% | 0.05% | 0.43% | -0.23% | -0.08% | 0.37% | 0.15% | |
| JPY | -0.79% | -0.52% | -0.43% | -0.75% | -0.53% | -0.15% | -0.15% | |
| CAD | -0.03% | 0.28% | 0.23% | 0.75% | 0.25% | 0.60% | 0.57% | |
| AUD | -0.23% | 0.14% | 0.08% | 0.53% | -0.25% | 0.46% | 0.20% | |
| NZD | -0.65% | -0.34% | -0.37% | 0.15% | -0.60% | -0.46% | -0.22% | |
| CHF | -0.43% | -0.10% | -0.15% | 0.15% | -0.57% | -0.20% | 0.22% |
The heat map shows percentage changes of major currencies against each other. The base currency is picked from the left column, while the quote currency is picked from the top row. For example, if you pick the Australian Dollar from the left column and move along the horizontal line to the US Dollar, the percentage change displayed in the box will represent AUD (base)/USD (quote).
![]()
Created
: 2024.09.09
![]()
Last updated
: 2024.09.09

FXStreet is a forex information website, delivering market analysis and news articles 24/7.
It features a number of articles contributed by well-known analysts, in addition to the ones by its editorial team.
Founded in 2000 by Francesc Riverola, a Spanish economist, it has grown to become a world-renowned information website.
We hope you find this article useful. Any comments or suggestions will be greatly appreciated.
We are also looking for writers with extensive experience in forex and crypto to join us.
please contact us at [email protected].
Disclaimer:![]()
All information and content provided on this website is provided for informational purposes only and is not intended to solicit any investment. Although all efforts are made in order to ensure that the information is correct, no guarantee is provided for the accuracy of any content on this website. Any decision made shall be the responsibility of the investor and Myforex does not take any responsibility whatsoever regarding the use of any information provided herein.
The content provided on this website belongs to Myforex and, where stated, the relevant licensors. All rights are reserved by Myforex and the relevant licensors, and no content of this website, whether in full or in part, shall be copied or displayed elsewhere without the explicit written permission of the relevant copyright holder. If you wish to use any part of the content provided on this website, please ensure that you contact Myforex.
Myforex uses cookies to improve the convenience and functionality of this website. This website may include cookies not only by us but also by third parties (advertisers, log analysts, etc.) for the purpose of tracking the activities of users. Cookie policy
