
Created
: 2024.09.06


![]() 2024.09.06 03:46
2024.09.06 03:46
The Dow Jones Industrial Average (DJIA) ground 400 points lower on Thursday, shedding weight for the second time this week after US jobs data came in below expectations. Equities have since recovered from the day's initial shock selloff, but the Dow Jones is struggling to return to flat for the day. ADP Employment Change showed its slowest rate of job additions since February of 2021, sparking a fresh round of risk aversion as investors grapple with the threat of a possible recession within the US economy.
According to payroll processor ADP, the US added 99K net new jobs in August, down from July's revised 111K and well below the expected 145K. August's ADP additions are the lowest print since early 2021, sparking a fresh round of risk aversion and reigniting investor concerns that the US could be heading into a recession.
The ADP jobs report serves as a bellwether for what markets can expect from Friday's upcoming US Nonfarm Payrolls (NFP) report, albeit one with a wobbly track record for accuracy. August's NFP print represents the last significant labor update before the Federal Reserve's (Fed) upcoming rate call on September 18, when Fed policymakers are broadly expected to kick off a rate-cutting cycle.
According to the CME, rate markets are currently betting on 40% odds that the Fed will blow the doors open with a 50 bps cut later in the month, with the remaining 60% betting on a more demure 25 bps opening rate trim. Investors are anticipating using this Friday's NFP print as a way to gauge the depth of the Fed's first rate cut since the Fed slashed 100 bps in March of 2020.
The ADP Employment Change is a gauge of employment in the private sector released by the largest payroll processor in the US, Automatic Data Processing Inc. It measures the change in the number of people privately employed in the US. Generally speaking, a rise in the indicator has positive implications for consumer spending and is stimulative of economic growth. So a high reading is traditionally seen as bullish for the US Dollar (USD), while a low reading is seen as bearish.
Read more.Last release: Thu Sep 05, 2024 12:15
Frequency: Monthly
Actual: 99K
Consensus: 145K
Previous: 122K
Source: ADP Research Institute
Traders often consider employment figures from ADP, America's largest payrolls provider, report as the harbinger of the Bureau of Labor Statistics release on Nonfarm Payrolls (usually published two days later), because of the correlation between the two. The overlaying of both series is quite high, but on individual months, the discrepancy can be substantial. Another reason FX traders follow this report is the same as with the NFP - a persistent vigorous growth in employment figures increases inflationary pressures, and with it, the likelihood that the Fed will raise interest rates. Actual figures beating consensus tend to be USD bullish.
The Dow Jones plunged around 400 points on Thursday before recovering to a more modest 150 point decline. Despite a broad-base recovery bid, the DJIA was still tilted heavily towards the bearish side, with all but five of the equity index's constituent securities testing into the red. Merch & Co (MRK) managed to squeeze out a 3.28% gain despite Thursday's bearish overtones, rising to $119.60 per share, while biotech firm Amgen (AMGN) declined 1.62% to $325.28 per share as traders take a breather from bidding up the medical tech firm ,which is still up over 28% for the past year.
Elswhere on the Dow Jones, Verizon (VZ) stumbled after stockholders reacted poorly to the news that VZ will be forking over $20 billion to acquire Frontier Communications (FYBR).
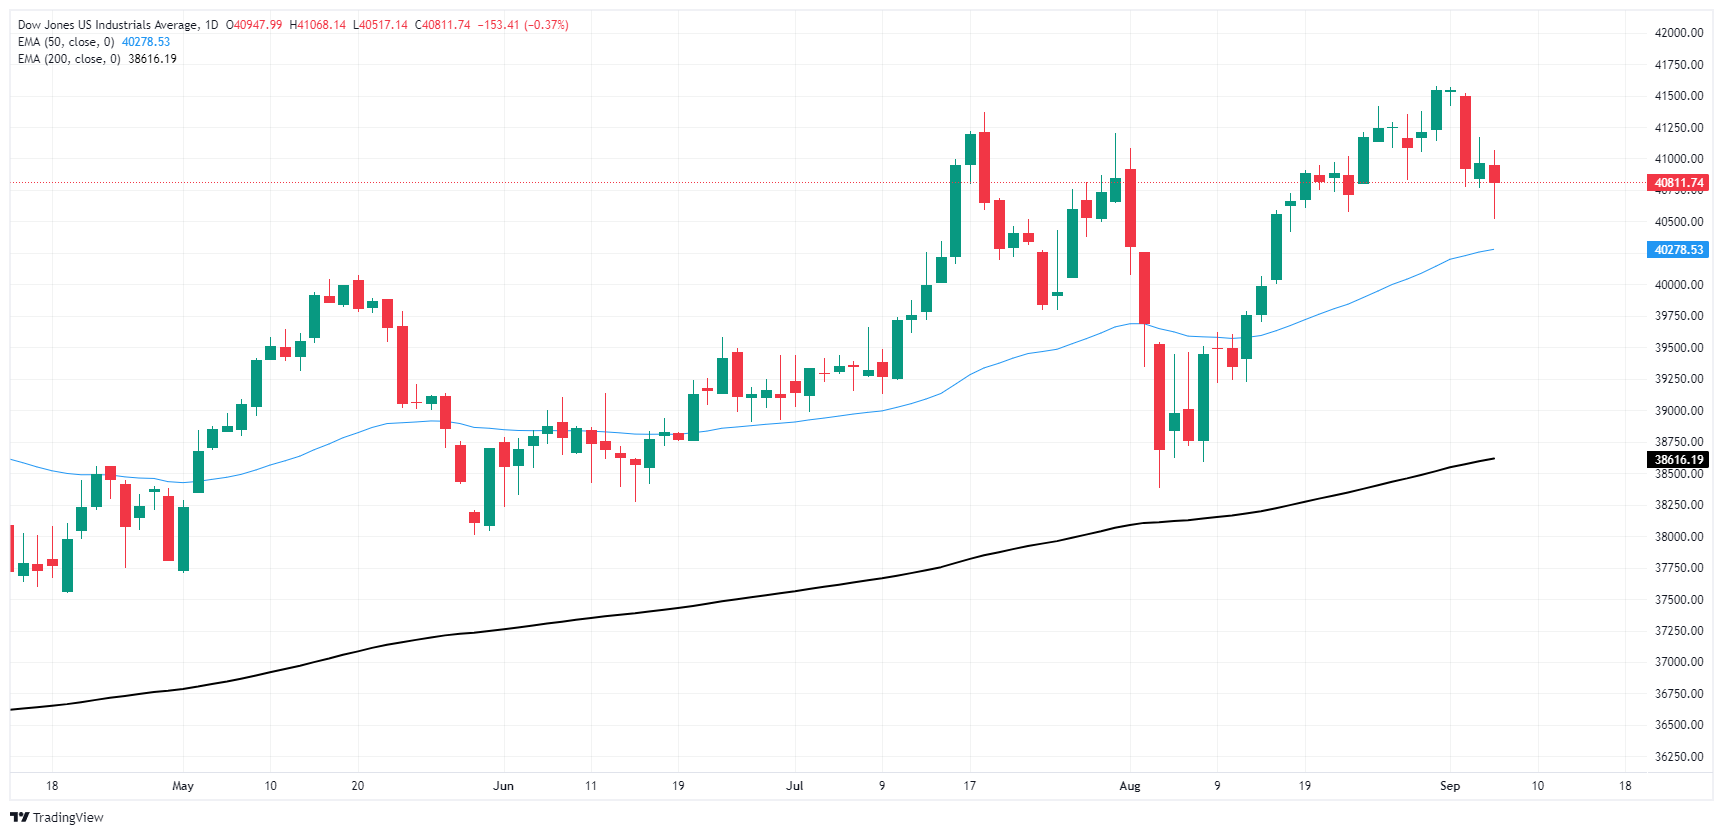
Despite a fresh intraday test into the low end, the Dow Jones continues to play in a technical range just south of the 41,000 handle. The DJIA is still trading on the south side of recent all-time highs above 41,500, but the odds of an extended bearish pullback are draining out of the index as bidders continue to challenge downside momentum.
The long-term trend still clearly favors the high side, and even a determined push from collecting short positions will run into trouble at the 50-day Exponential Moving Average (EMA) rising through 40,300.
The Dow Jones Industrial Average, one of the oldest stock market indices in the world, is compiled of the 30 most traded stocks in the US. The index is price-weighted rather than weighted by capitalization. It is calculated by summing the prices of the constituent stocks and dividing them by a factor, currently 0.152. The index was founded by Charles Dow, who also founded the Wall Street Journal. In later years it has been criticized for not being broadly representative enough because it only tracks 30 conglomerates, unlike broader indices such as the S&P 500.
Many different factors drive the Dow Jones Industrial Average (DJIA). The aggregate performance of the component companies revealed in quarterly company earnings reports is the main one. US and global macroeconomic data also contributes as it impacts on investor sentiment. The level of interest rates, set by the Federal Reserve (Fed), also influences the DJIA as it affects the cost of credit, on which many corporations are heavily reliant. Therefore, inflation can be a major driver as well as other metrics which impact the Fed decisions.
Dow Theory is a method for identifying the primary trend of the stock market developed by Charles Dow. A key step is to compare the direction of the Dow Jones Industrial Average (DJIA) and the Dow Jones Transportation Average (DJTA) and only follow trends where both are moving in the same direction. Volume is a confirmatory criteria. The theory uses elements of peak and trough analysis. Dow's theory posits three trend phases: accumulation, when smart money starts buying or selling; public participation, when the wider public joins in; and distribution, when the smart money exits.
There are a number of ways to trade the DJIA. One is to use ETFs which allow investors to trade the DJIA as a single security, rather than having to buy shares in all 30 constituent companies. A leading example is the SPDR Dow Jones Industrial Average ETF (DIA). DJIA futures contracts enable traders to speculate on the future value of the index and Options provide the right, but not the obligation, to buy or sell the index at a predetermined price in the future. Mutual funds enable investors to buy a share of a diversified portfolio of DJIA stocks thus providing exposure to the overall index.
![]()
Created
: 2024.09.06
![]()
Last updated
: 2024.09.06

FXStreet is a forex information website, delivering market analysis and news articles 24/7.
It features a number of articles contributed by well-known analysts, in addition to the ones by its editorial team.
Founded in 2000 by Francesc Riverola, a Spanish economist, it has grown to become a world-renowned information website.
We hope you find this article useful. Any comments or suggestions will be greatly appreciated.
We are also looking for writers with extensive experience in forex and crypto to join us.
please contact us at [email protected].
Disclaimer:![]()
All information and content provided on this website is provided for informational purposes only and is not intended to solicit any investment. Although all efforts are made in order to ensure that the information is correct, no guarantee is provided for the accuracy of any content on this website. Any decision made shall be the responsibility of the investor and Myforex does not take any responsibility whatsoever regarding the use of any information provided herein.
The content provided on this website belongs to Myforex and, where stated, the relevant licensors. All rights are reserved by Myforex and the relevant licensors, and no content of this website, whether in full or in part, shall be copied or displayed elsewhere without the explicit written permission of the relevant copyright holder. If you wish to use any part of the content provided on this website, please ensure that you contact Myforex.
Myforex uses cookies to improve the convenience and functionality of this website. This website may include cookies not only by us but also by third parties (advertisers, log analysts, etc.) for the purpose of tracking the activities of users. Cookie policy
