Created
: 2024.09.03


![]() 2024.09.03 19:30
2024.09.03 19:30
Natural Gas is trading near $2.32 with some bearish and bullish elements in play, keeping Natural Gas prices rather stable. The bullish elements are coming from tensions in the Middle East, where Israeli people are starting to question the approach from Israel's Prime Minister Benjamin Netanyahu and demand a swift ceasefire and peace deal to get hostages return safely. On the other side, bearish news comes out from Europe with Gas storages near full ahead of the next heating season and the German car industry struggling.
Meanwhile, the US Dollar Index (DXY), which tracks the Greenback's value against six major currencies, is holding on to its recovery taking place last week. Markets got wrong-footed after the Jackson Hole speech from US Federal Reserve Chairman Jerome Powell, going all in that a September rate cut might be bigger than 25 basis points. Recent US data shows that even a 25 basis points rate cut starts to get doubted, with the Nonfarm Payrolls report on Friday to be a key data point to confirm how big that September rate cut will be.
Natural Gas is trading at $2.32 per MMBtu at the time of writing.
Natural Gas prices are a bit torn as any upside looks limited for now. Europe has far succeeded in reaching its goal of securing enough Gas to make it through the next heating season. Meanwhile, Russia is facing pressure in its financial system with China pulling its liquidity support due to US sanctions and Ukraine's excursion into Russia. Expect any upside in the Gas prices to remain subdued with no real substantial rallies to take place if current events remain as they are.
Should more bullish headlines emerge and push the Gas price higher, look ahead for moving averages as upside resistances. First, the 100-day Simple Moving Average (SMA) at $2.42 would already be a significant move higher. Further up, the green ascending trend line at $2.56 could be tested.
On the downside, very close support from the 200-day SMA at $2.29 should avoid that Gas prices fall lower. In case that level snaps, $2.13 comes back into play for a test and possible dip below. Although still far away, a return to $2.00 or lower could mean a test at the low of August, with $1.93 in the cards.
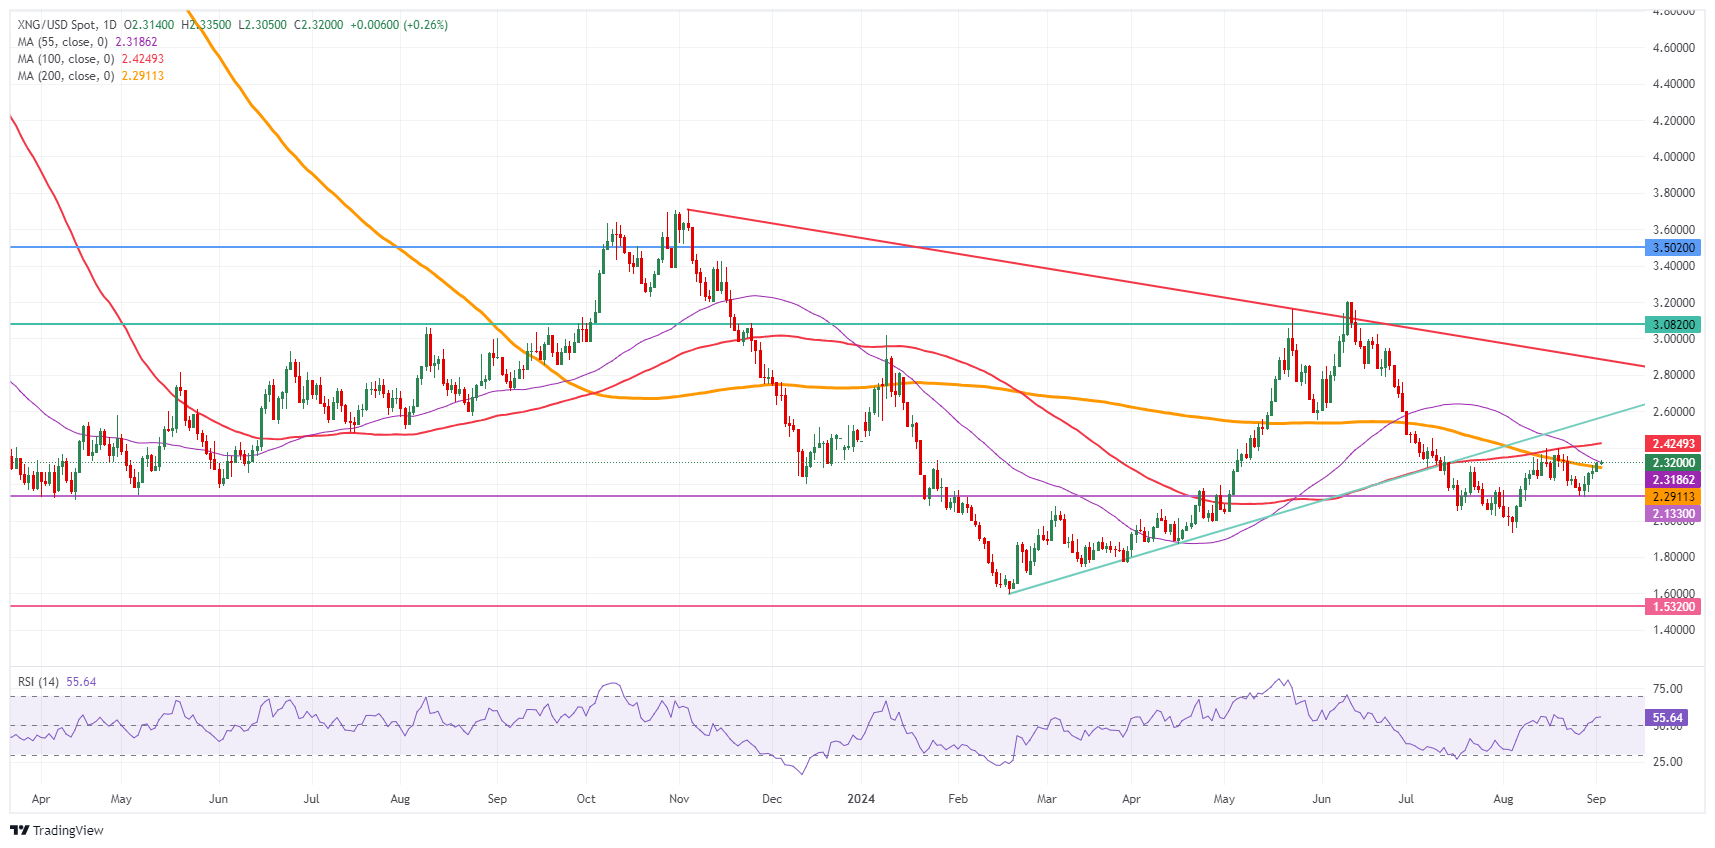
Natural Gas: Daily Chart
Supply and demand dynamics are a key factor influencing Natural Gas prices, and are themselves influenced by global economic growth, industrial activity, population growth, production levels, and inventories. The weather impacts Natural Gas prices because more Gas is used during cold winters and hot summers for heating and cooling. Competition from other energy sources impacts prices as consumers may switch to cheaper sources. Geopolitical events are factors as exemplified by the war in Ukraine. Government policies relating to extraction, transportation, and environmental issues also impact prices.
The main economic release influencing Natural Gas prices is the weekly inventory bulletin from the Energy Information Administration (EIA), a US government agency that produces US gas market data. The EIA Gas bulletin usually comes out on Thursday at 14:30 GMT, a day after the EIA publishes its weekly Oil bulletin. Economic data from large consumers of Natural Gas can impact supply and demand, the largest of which include China, Germany and Japan. Natural Gas is primarily priced and traded in US Dollars, thus economic releases impacting the US Dollar are also factors.
The US Dollar is the world's reserve currency and most commodities, including Natural Gas are priced and traded on international markets in US Dollars. As such, the value of the US Dollar is a factor in the price of Natural Gas, because if the Dollar strengthens it means less Dollars are required to buy the same volume of Gas (the price falls), and vice versa if USD strengthens.
![]()
Created
: 2024.09.03
![]()
Last updated
: 2024.09.03

FXStreet is a forex information website, delivering market analysis and news articles 24/7.
It features a number of articles contributed by well-known analysts, in addition to the ones by its editorial team.
Founded in 2000 by Francesc Riverola, a Spanish economist, it has grown to become a world-renowned information website.
We hope you find this article useful. Any comments or suggestions will be greatly appreciated.
We are also looking for writers with extensive experience in forex and crypto to join us.
please contact us at [email protected].
Disclaimer:![]()
All information and content provided on this website is provided for informational purposes only and is not intended to solicit any investment. Although all efforts are made in order to ensure that the information is correct, no guarantee is provided for the accuracy of any content on this website. Any decision made shall be the responsibility of the investor and Myforex does not take any responsibility whatsoever regarding the use of any information provided herein.
The content provided on this website belongs to Myforex and, where stated, the relevant licensors. All rights are reserved by Myforex and the relevant licensors, and no content of this website, whether in full or in part, shall be copied or displayed elsewhere without the explicit written permission of the relevant copyright holder. If you wish to use any part of the content provided on this website, please ensure that you contact Myforex.
Myforex uses cookies to improve the convenience and functionality of this website. This website may include cookies not only by us but also by third parties (advertisers, log analysts, etc.) for the purpose of tracking the activities of users. Cookie policy
