Created
: 2024.08.23


![]() 2024.08.23 19:56
2024.08.23 19:56
EUR/GBP continues descending within a falling channel, clearly visible on the 4-hour chart below.
The declining sequence of peaks and troughs supposes the pair is in a short-term downtrend, and given "the trend is your friend" this biases prices to further weakness.
However, even strongly trending prices experience pull backs from time to time, and EUR/GBP has reached the lower channel line of the channel where previously it found support and began counter-trend reactions back up inside the channel. There is a chance the same may happen again.
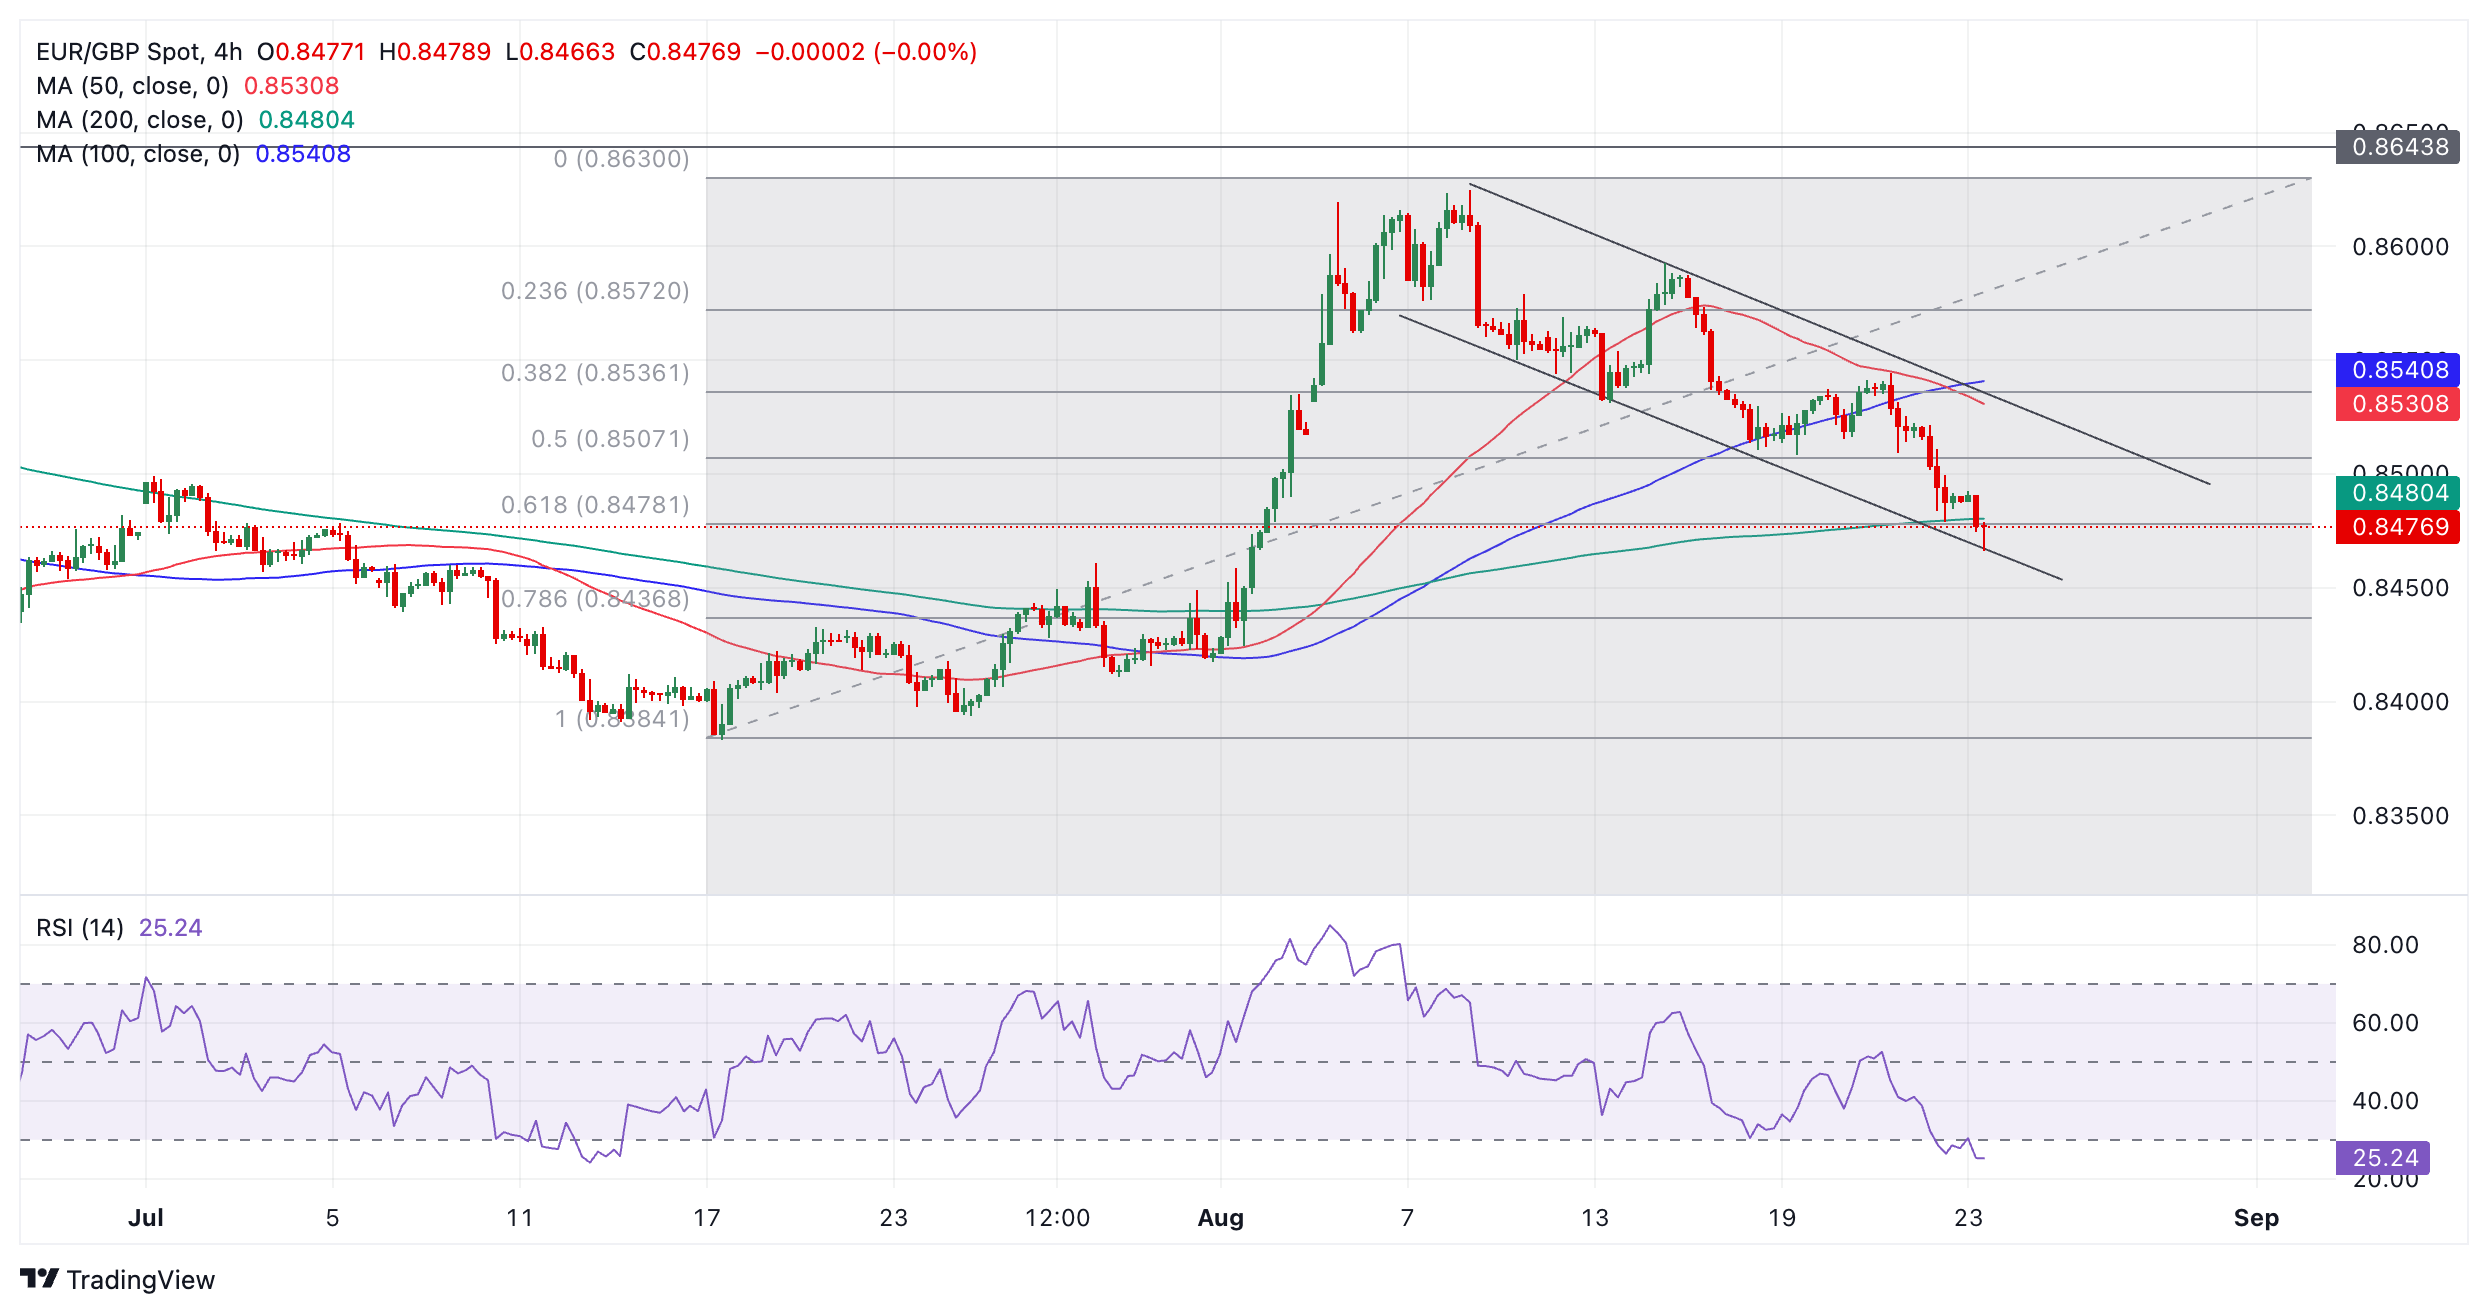
Further supporting the pull-back hypothesis is the fact the Relative Strength Index (RSI) is heavily oversold. Although this alone is not enough to signal a recovery it does caution traders not to add to their short positions. Those wishing to trade the counter-trend rally should wait for RSI to exit oversold and re-enter neutral territory before placing buy orders.
EUR/GBP is also testing both the 200-period Simple Moving Average (SMA) and the 0.618 Fibonacci retracement level of the late-June and early-August rally at 0.8478. On the daily chart (not shown) it is also testing the key 50-day SMA. This confluence of support further increases the probability of a recovery unfolding.
The price itself is forming what might end up as a bullish Hammer Japanese candlestick reversal pattern on the current 4-hour bar, however, until the period ends it is not possible to be certain. For such patterns to gain confirmation they also need to be followed by a bullish green candle.
It is possible - given the short-term downtrend - that EUR/GBP could break below the channel line and continue falling. A decisive break below the lower channel line would validate such a breakout. It would be a very bearish sign but unlikely to last as such moves are often signs of exhaustion.
A decisive break would be one accompanied by a longer-than-average red candlestick which closed below the channel line near its low, or three red candlesticks in a row that broke below the level.
The long-term trend (weekly chart) is still bearish whilst the medium-term trend is bullish.
![]()
Created
: 2024.08.23
![]()
Last updated
: 2024.08.23

FXStreet is a forex information website, delivering market analysis and news articles 24/7.
It features a number of articles contributed by well-known analysts, in addition to the ones by its editorial team.
Founded in 2000 by Francesc Riverola, a Spanish economist, it has grown to become a world-renowned information website.
We hope you find this article useful. Any comments or suggestions will be greatly appreciated.
We are also looking for writers with extensive experience in forex and crypto to join us.
please contact us at [email protected].
Disclaimer:![]()
All information and content provided on this website is provided for informational purposes only and is not intended to solicit any investment. Although all efforts are made in order to ensure that the information is correct, no guarantee is provided for the accuracy of any content on this website. Any decision made shall be the responsibility of the investor and Myforex does not take any responsibility whatsoever regarding the use of any information provided herein.
The content provided on this website belongs to Myforex and, where stated, the relevant licensors. All rights are reserved by Myforex and the relevant licensors, and no content of this website, whether in full or in part, shall be copied or displayed elsewhere without the explicit written permission of the relevant copyright holder. If you wish to use any part of the content provided on this website, please ensure that you contact Myforex.
Myforex uses cookies to improve the convenience and functionality of this website. This website may include cookies not only by us but also by third parties (advertisers, log analysts, etc.) for the purpose of tracking the activities of users. Cookie policy
