Created
: 2024.08.21


![]() 2024.08.21 20:52
2024.08.21 20:52
Oil trades sideways on Wednesday, following three sessions of sharp selloffs, after several news outlets reported that a tanker got hit in the Red Sea by Houthi rebels. Delta Tankers has confirmed that one of its vessels, Sounion, has been attacked and is suffering minor damage. This element is very unwelcome at the moment Hamas is considering the ceasefire proposal in Gaza that both Israel and the US have put on the table.
The US Dollar Index (DXY), which tracks the performance of the US Dollar against six major currencies, is in a similar pattern as Crude Oil as it tries to snap this week's losing streak. However, the DXY had to hit rock bottom in order to do so, giving up all gains for 2024 and literally falling flat on the year before a small bounce could occur. The main event this Wednesday is the Federal Open Market Committee (FOMC) Minutes release ahead of Jackson Hole on Friday, together with the Nonfarm Payrolls Benchmark Revision that will possibly change nonfarm data over one year up until March of this year.
At the time of writing, Crude Oil (WTI) trades at $73.07 and Brent Crude at $76.79.
The EIA Crude Oil stockpiles report is a weekly measure of the change in the number of barrels in stock of crude oil and its derivates, and it's released by the Energy Information Administration. This report tends to generate large price volatility, as oil prices impact on worldwide economies, affecting the most, commodity related currencies such as the Canadian dollar. Despite it has a limited impact among currencies, this report tends to affect the price of oil itself, and, therefore, had a more notorious impact on WTI crude futures.
Read more.Next release: Wed Aug 21, 2024 14:30
Frequency: Weekly
Consensus: -2.8M
Previous: 1.357M
Oil tries to snap its losing streak and boot-start a recovery, although this looks rather bleak.. Still, the recent surge in attacks in the Red Sea could mean headaches ahead for the ceasefire deal that is on the table for Hamas to consider at the moment, and could quickly see a surge in violence again if the situation escalates further.
On the upside, it becomes very difficult to be bullish with a lot of resistance levels nearby. The first element to look out for is the pivotal $75.27. Next up is the double level at $77.65, which aligns with both a descending trendline and the 200-day Simple Moving Average (SMA). In case bulls are able to break above it, the 100-day SMA at $78.45 could trigger another rejection as it did last week.
On the downside, the low from August 5 at $71.17 is the best level for a bounce. It might not be bad to start considering levels below $70.00, particularly if ceasefire talks bear fruit and hedge funds start selling their speculative stake in Oil contracts. The $68.00 big figure level is the first level to watch followed by $67.11, which is the lowest point from the triple bottom seen back in June 2023.
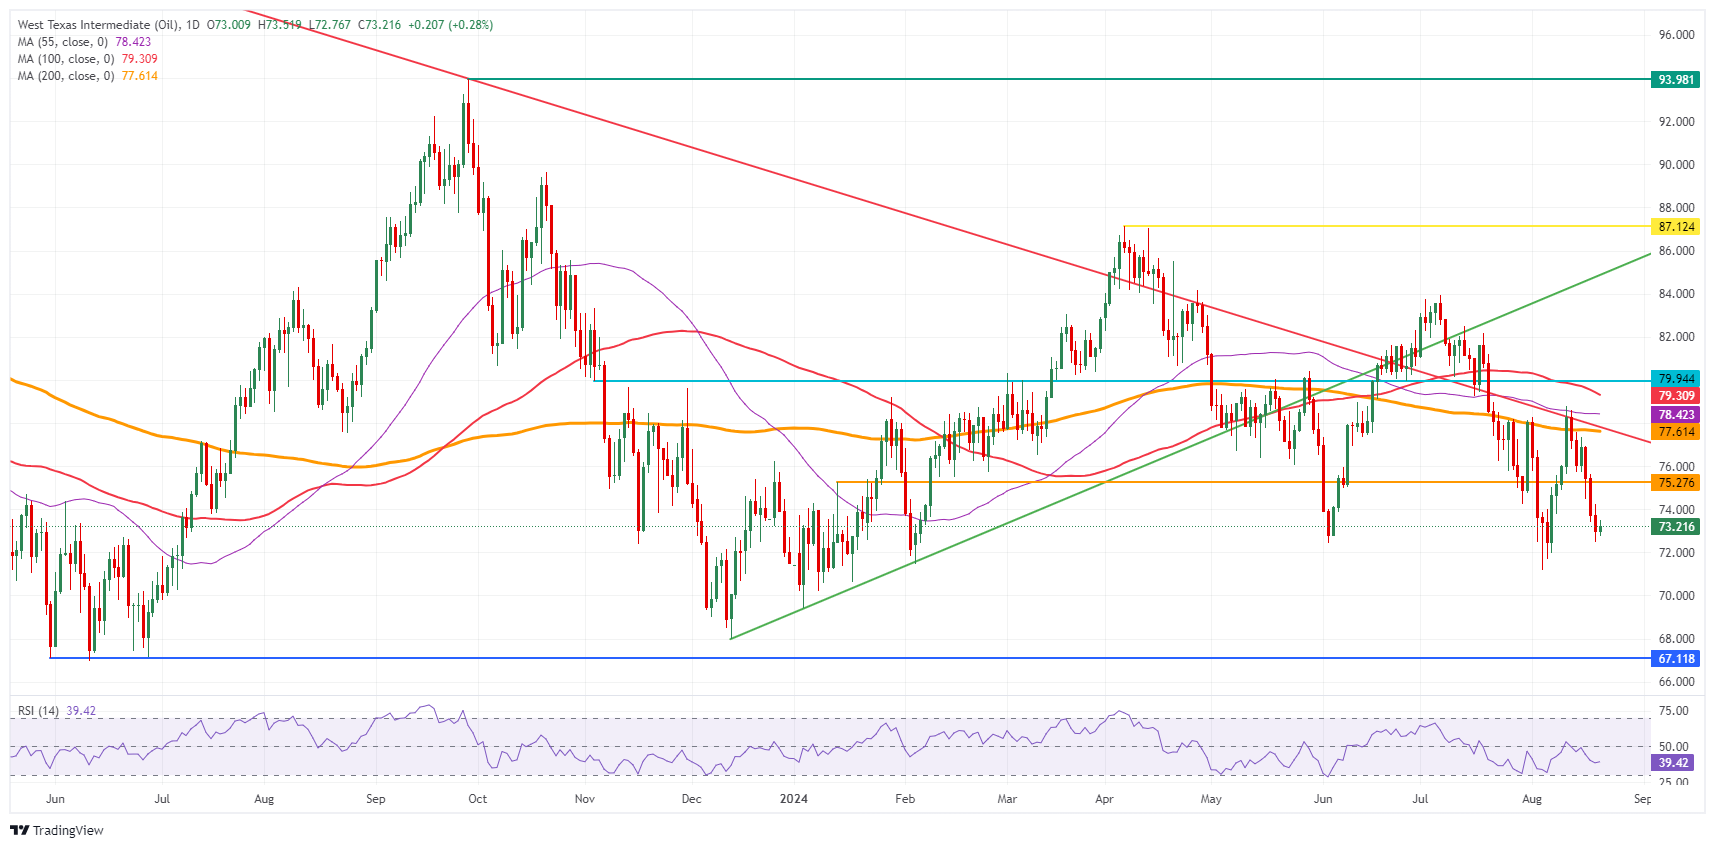
US WTI Crude Oil: Daily Chart
WTI Oil is a type of Crude Oil sold on international markets. The WTI stands for West Texas Intermediate, one of three major types including Brent and Dubai Crude. WTI is also referred to as "light" and "sweet" because of its relatively low gravity and sulfur content respectively. It is considered a high quality Oil that is easily refined. It is sourced in the United States and distributed via the Cushing hub, which is considered "The Pipeline Crossroads of the World". It is a benchmark for the Oil market and WTI price is frequently quoted in the media.
Like all assets, supply and demand are the key drivers of WTI Oil price. As such, global growth can be a driver of increased demand and vice versa for weak global growth. Political instability, wars, and sanctions can disrupt supply and impact prices. The decisions of OPEC, a group of major Oil-producing countries, is another key driver of price. The value of the US Dollar influences the price of WTI Crude Oil, since Oil is predominantly traded in US Dollars, thus a weaker US Dollar can make Oil more affordable and vice versa.
The weekly Oil inventory reports published by the American Petroleum Institute (API) and the Energy Information Agency (EIA) impact the price of WTI Oil. Changes in inventories reflect fluctuating supply and demand. If the data shows a drop in inventories it can indicate increased demand, pushing up Oil price. Higher inventories can reflect increased supply, pushing down prices. API's report is published every Tuesday and EIA's the day after. Their results are usually similar, falling within 1% of each other 75% of the time. The EIA data is considered more reliable, since it is a government agency.
OPEC (Organization of the Petroleum Exporting Countries) is a group of 13 Oil-producing nations who collectively decide production quotas for member countries at twice-yearly meetings. Their decisions often impact WTI Oil prices. When OPEC decides to lower quotas, it can tighten supply, pushing up Oil prices. When OPEC increases production, it has the opposite effect. OPEC+ refers to an expanded group that includes ten extra non-OPEC members, the most notable of which is Russia.
![]()
Created
: 2024.08.21
![]()
Last updated
: 2024.08.21

FXStreet is a forex information website, delivering market analysis and news articles 24/7.
It features a number of articles contributed by well-known analysts, in addition to the ones by its editorial team.
Founded in 2000 by Francesc Riverola, a Spanish economist, it has grown to become a world-renowned information website.
We hope you find this article useful. Any comments or suggestions will be greatly appreciated.
We are also looking for writers with extensive experience in forex and crypto to join us.
please contact us at [email protected].
Disclaimer:![]()
All information and content provided on this website is provided for informational purposes only and is not intended to solicit any investment. Although all efforts are made in order to ensure that the information is correct, no guarantee is provided for the accuracy of any content on this website. Any decision made shall be the responsibility of the investor and Myforex does not take any responsibility whatsoever regarding the use of any information provided herein.
The content provided on this website belongs to Myforex and, where stated, the relevant licensors. All rights are reserved by Myforex and the relevant licensors, and no content of this website, whether in full or in part, shall be copied or displayed elsewhere without the explicit written permission of the relevant copyright holder. If you wish to use any part of the content provided on this website, please ensure that you contact Myforex.
Myforex uses cookies to improve the convenience and functionality of this website. This website may include cookies not only by us but also by third parties (advertisers, log analysts, etc.) for the purpose of tracking the activities of users. Cookie policy
