Created
: 2024.07.03


![]() 2024.07.03 07:08
2024.07.03 07:08
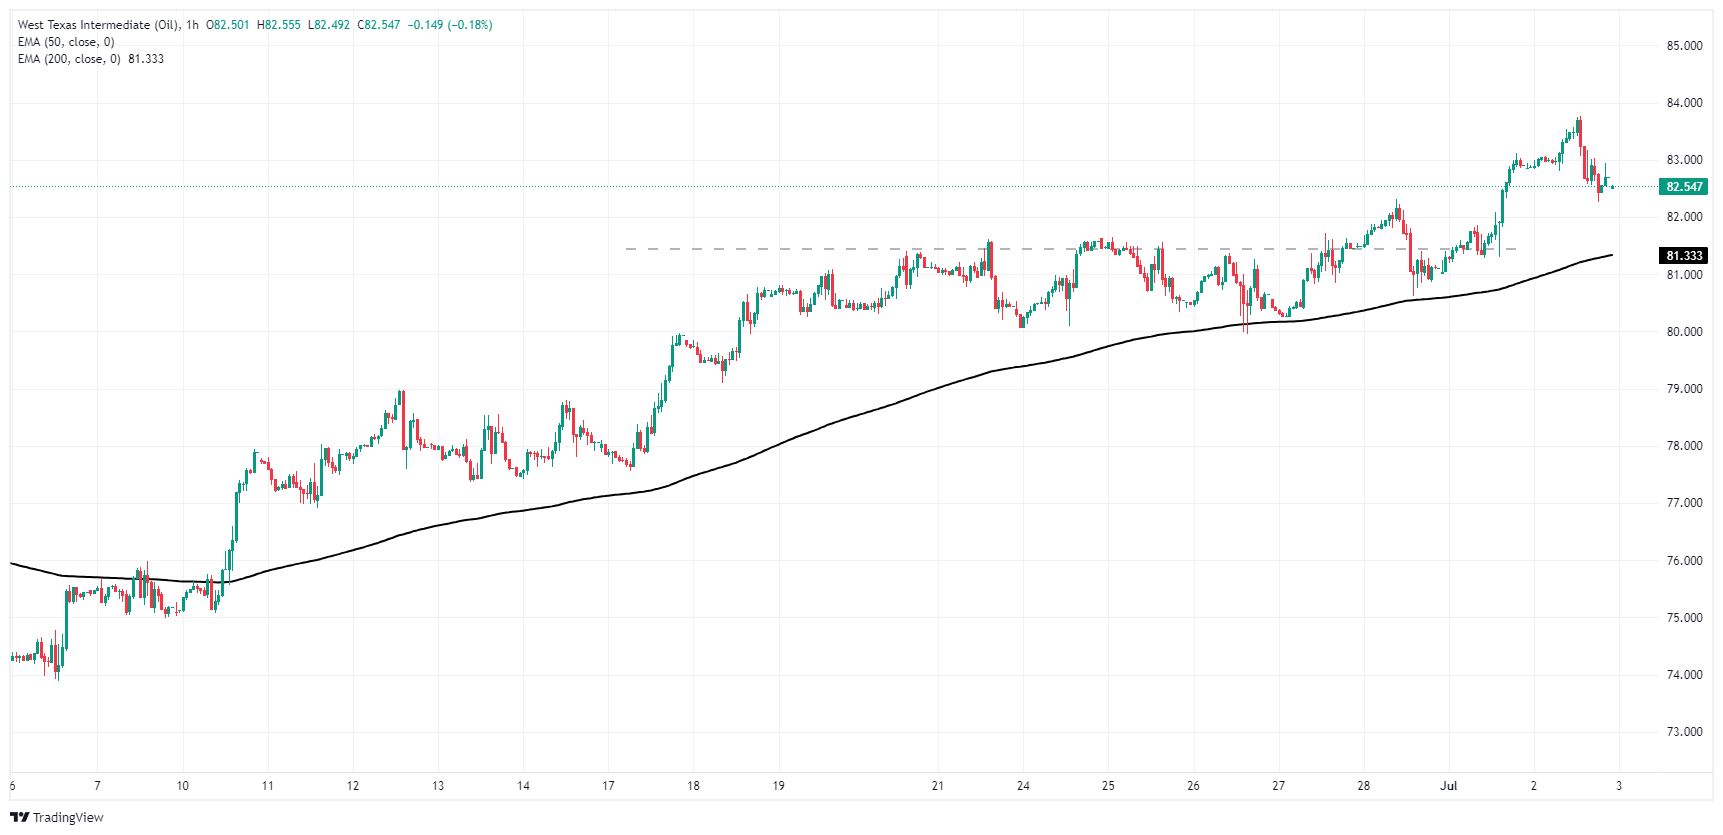
West Texas Intermediate (WTI) US Crude Oil briefly clipped into a nine-week peak just shy of $84.00 per barrel on Tuesday before mid-US session market flows pulled barrel bids back down to $82.50.
Crude Oil markets continue to be bolstered by ongoing tensions in the Middle East. The Israel-Palestinian Hamas conflict continues to roil energy markets as investors remain concerned that a cross-border spillover of the conflict would involve direct action from Iran, which backs Hamas and would threaten Crude Oil supplies and logistics stability in the region.
The American Petroleum Institute (API) noted its steepest week-on-week US Weekly Crude Oil Stocks in nearly two years; API barrel counts noted a weekly decline of -9.163 million, far below the forecast -150K drawdown and adding to the previous week's -3 million barrel decline.
Despite the sharp downturn in Crude Oil stocks, WTI bids remain constrained on Tuesday's low end after the API also noted a 2.468 million uptick in Gasoline counts as refiners prepare for the summer travel peak. Distillate inventories declined -740K for the week ended June 28, and US Crude Oil stocks at the Cushing facility still rose 404K barrels.
API's Weekly Statistical Bulletin (WSB) has reported total U.S. and regional data relating to refinery operations and the production of the four major petroleum products: motor gasoline, kerosene jet fuel, distillate (by sulfur content), and residual fuel oil. These products represent more than 85% of total petroleum industry.
Read more.Last release: Tue Jul 02, 2024 20:30
Frequency: Weekly
Actual: -9.163M
Consensus: -0.15M
Previous: 0.914M
Source: American Petroleum Institute
WTI has broken north of near-term consolidation around the $81.50 region, but intraday bullish momentum failed to breach $84.00 per barrel. WTI is primed for a near-term pullback to median bids at the 200-hour Exponential Moving Average (EMA) at $81.28.
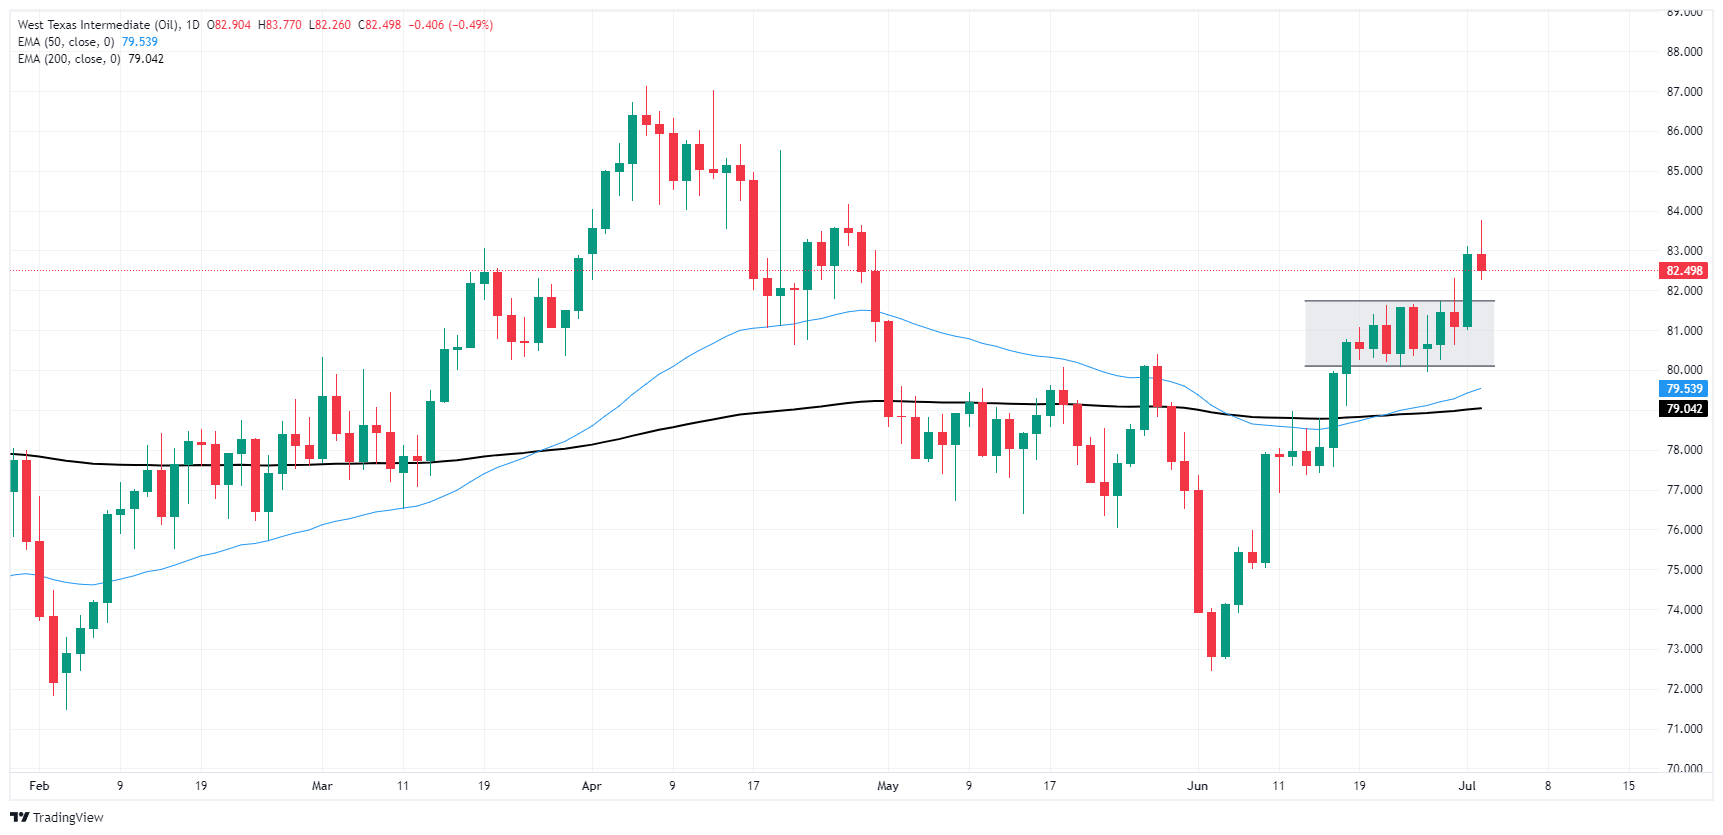
After a bullish breakout from near-term consolidation, WTI is drawing a potential bearish signal as topside momentum remains thin and US Crude Oil trades just north of the 200-day EMA near $79.00.
WTI Oil is a type of Crude Oil sold on international markets. The WTI stands for West Texas Intermediate, one of three major types including Brent and Dubai Crude. WTI is also referred to as "light" and "sweet" because of its relatively low gravity and sulfur content respectively. It is considered a high quality Oil that is easily refined. It is sourced in the United States and distributed via the Cushing hub, which is considered "The Pipeline Crossroads of the World". It is a benchmark for the Oil market and WTI price is frequently quoted in the media.
Like all assets, supply and demand are the key drivers of WTI Oil price. As such, global growth can be a driver of increased demand and vice versa for weak global growth. Political instability, wars, and sanctions can disrupt supply and impact prices. The decisions of OPEC, a group of major Oil-producing countries, is another key driver of price. The value of the US Dollar influences the price of WTI Crude Oil, since Oil is predominantly traded in US Dollars, thus a weaker US Dollar can make Oil more affordable and vice versa.
The weekly Oil inventory reports published by the American Petroleum Institute (API) and the Energy Information Agency (EIA) impact the price of WTI Oil. Changes in inventories reflect fluctuating supply and demand. If the data shows a drop in inventories it can indicate increased demand, pushing up Oil price. Higher inventories can reflect increased supply, pushing down prices. API's report is published every Tuesday and EIA's the day after. Their results are usually similar, falling within 1% of each other 75% of the time. The EIA data is considered more reliable, since it is a government agency.
OPEC (Organization of the Petroleum Exporting Countries) is a group of 13 Oil-producing nations who collectively decide production quotas for member countries at twice-yearly meetings. Their decisions often impact WTI Oil prices. When OPEC decides to lower quotas, it can tighten supply, pushing up Oil prices. When OPEC increases production, it has the opposite effect. OPEC+ refers to an expanded group that includes ten extra non-OPEC members, the most notable of which is Russia.
![]()
Created
: 2024.07.03
![]()
Last updated
: 2024.07.03

FXStreet is a forex information website, delivering market analysis and news articles 24/7.
It features a number of articles contributed by well-known analysts, in addition to the ones by its editorial team.
Founded in 2000 by Francesc Riverola, a Spanish economist, it has grown to become a world-renowned information website.
We hope you find this article useful. Any comments or suggestions will be greatly appreciated.
We are also looking for writers with extensive experience in forex and crypto to join us.
please contact us at [email protected].
Disclaimer:![]()
All information and content provided on this website is provided for informational purposes only and is not intended to solicit any investment. Although all efforts are made in order to ensure that the information is correct, no guarantee is provided for the accuracy of any content on this website. Any decision made shall be the responsibility of the investor and Myforex does not take any responsibility whatsoever regarding the use of any information provided herein.
The content provided on this website belongs to Myforex and, where stated, the relevant licensors. All rights are reserved by Myforex and the relevant licensors, and no content of this website, whether in full or in part, shall be copied or displayed elsewhere without the explicit written permission of the relevant copyright holder. If you wish to use any part of the content provided on this website, please ensure that you contact Myforex.
Myforex uses cookies to improve the convenience and functionality of this website. This website may include cookies not only by us but also by third parties (advertisers, log analysts, etc.) for the purpose of tracking the activities of users. Cookie policy
