Created
: 2024.06.28


![]() 2024.06.28 20:07
2024.06.28 20:07
USD/CHF is probably in a short-term uptrend after breaking above the key 0.8989 resistance level (June 11 high). The reversal in trend means the odds now favor more upside going forward.
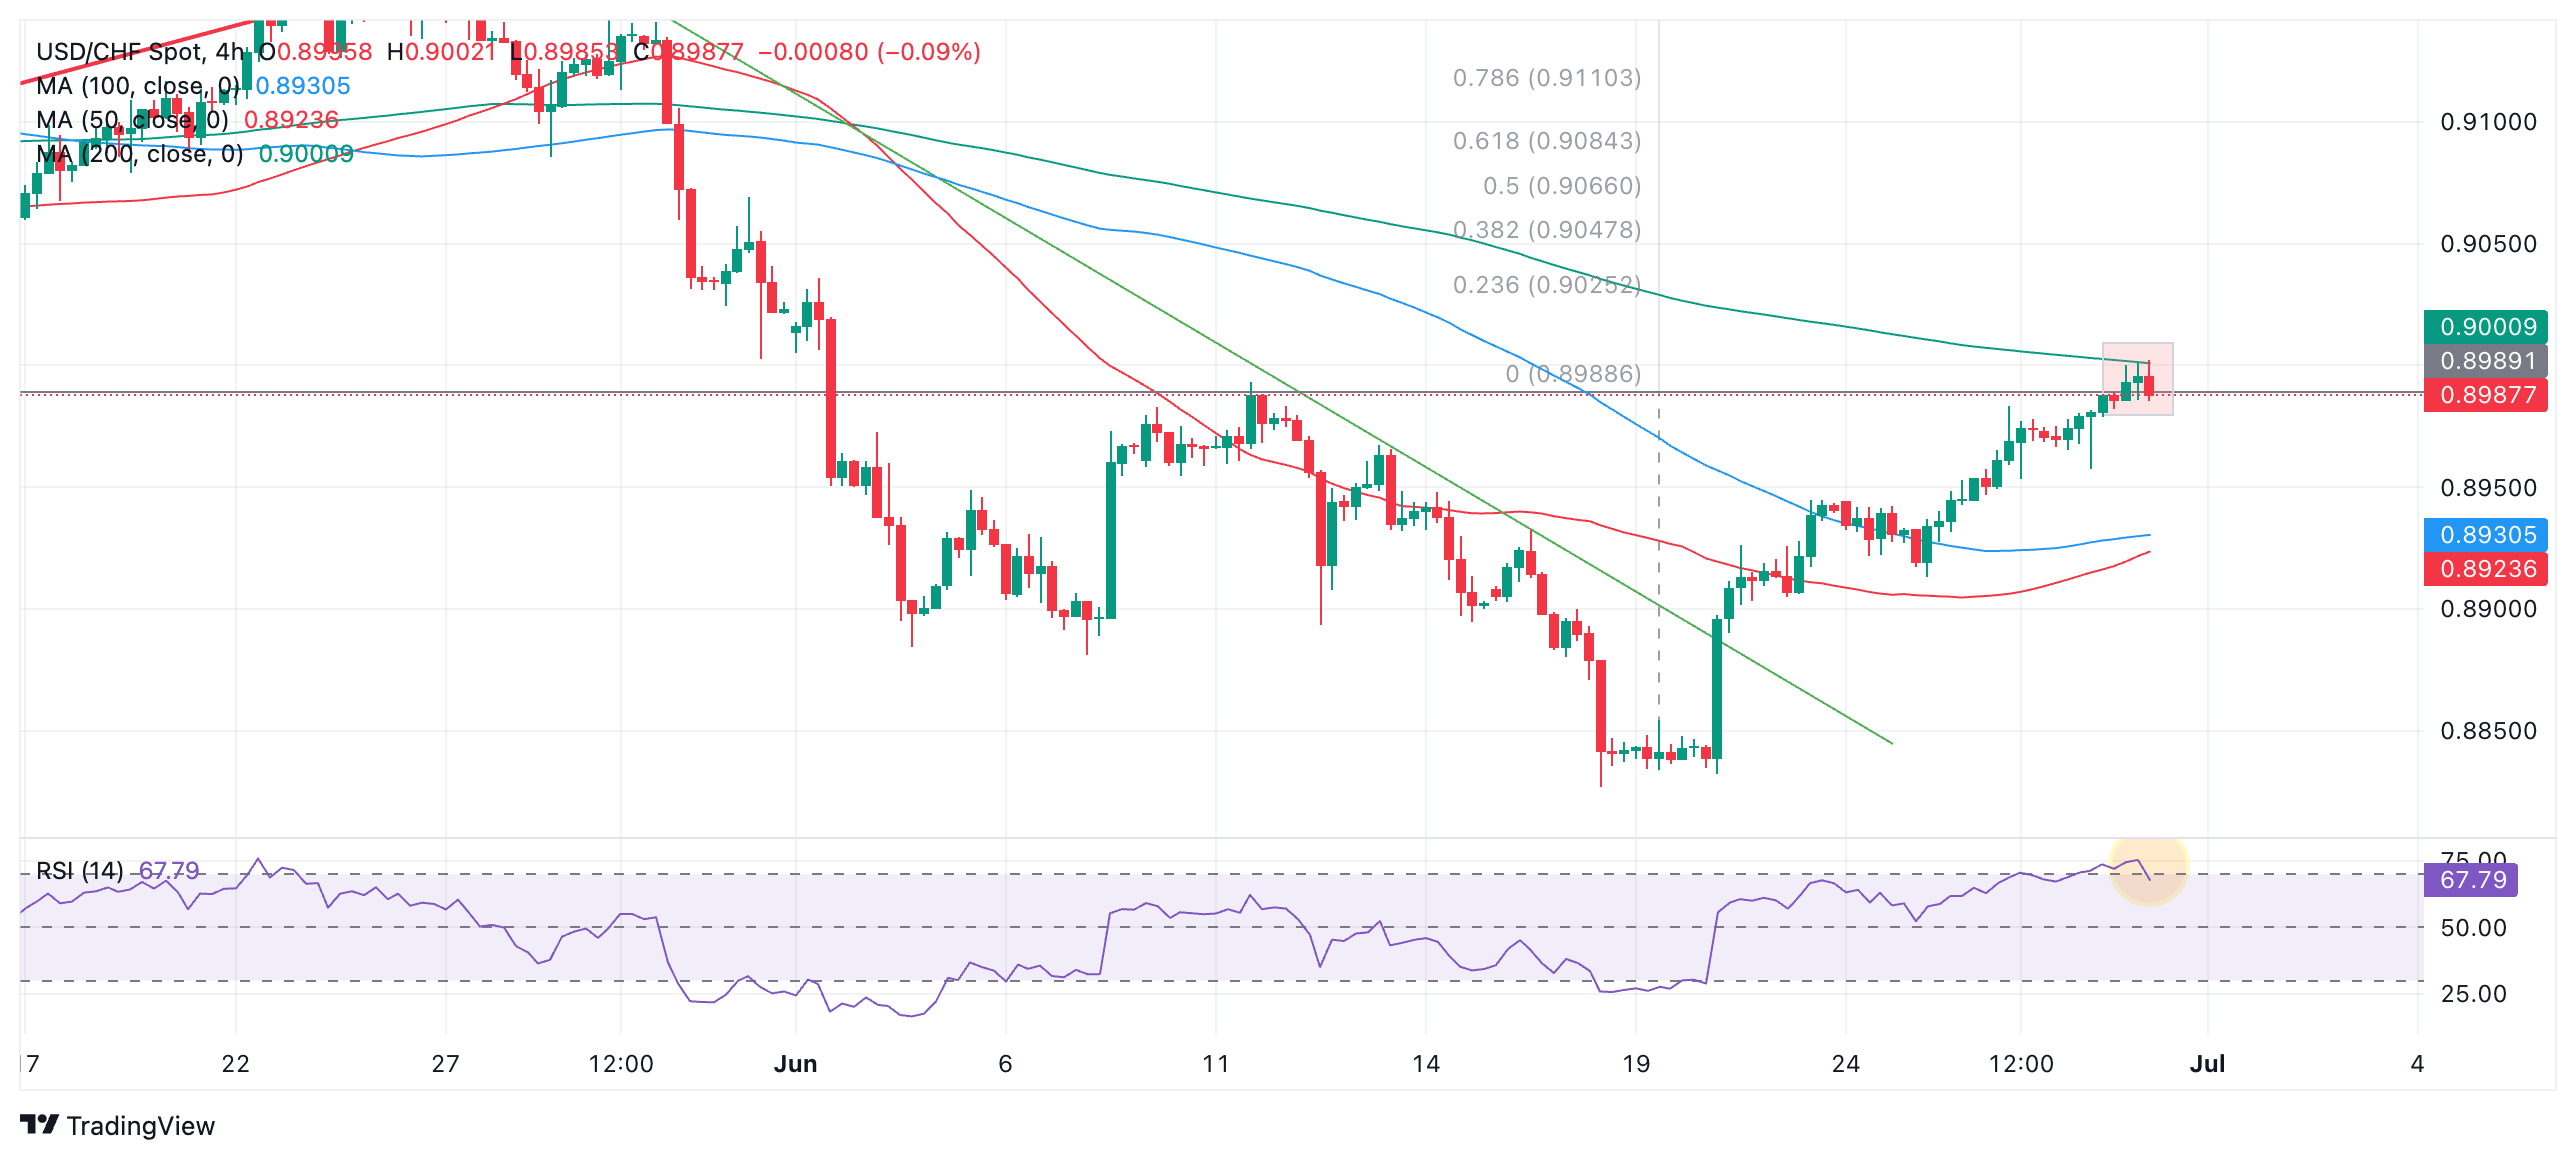
Upside targets for the pair lie at 0.9034 (50-day Simple Moving Average) followed by 0.9084, the 0.618 Fibonacci extension of the height of the bottoming pattern that evolved between June 11-27, and looks similar to a bullish Inverse Head and Shoulders (H&S) pattern. The distinctive square-shaped "head" that formed between June 18-20 is further evidence it might be an Inverse H&S.
A break on a closing basis clearly above 0.9000, and the green 200-period SMA would provide bullish confirmation of a continuation of the trend.
There are, however, signs a pullback may be evolving in the very near term. The Relative Strength Index (RSI) is overbought (shaded circle) and threatening to exit the overbought zone which would be a bearish sign. Whether or not it exits the overbought zone depends on how the current 4-hour bar closes. If it ends bullishly then the RSI will remain overbought; if bearishly it will exit overbought and suggest the beginning of a pullback.
Another sign a pullback may be developing is the Tweezer Top Japanese candlestick bearish reversal pattern (red shaded rectangle) that has formed over the past two candles. Tweezer tops occur at market tops when two bars both rise up to a similar high before closing back down near the middle of the candle. The pattern formed looks much like a "tweezer". It is a fairly reliable short-term reversal sign especially if followed by a bearish third candle. In this case the third candle is in the middle of completing so its not clear whether it will be red, however, it is at the time of writing.
A pullback, if it evolves, would be expected to fall to support at around the 0.8950s initially, from where it might turn around and begin rising again, in line with the dominant short-term uptrend.
![]()
Created
: 2024.06.28
![]()
Last updated
: 2024.06.28

FXStreet is a forex information website, delivering market analysis and news articles 24/7.
It features a number of articles contributed by well-known analysts, in addition to the ones by its editorial team.
Founded in 2000 by Francesc Riverola, a Spanish economist, it has grown to become a world-renowned information website.
We hope you find this article useful. Any comments or suggestions will be greatly appreciated.
We are also looking for writers with extensive experience in forex and crypto to join us.
please contact us at [email protected].
Disclaimer:![]()
All information and content provided on this website is provided for informational purposes only and is not intended to solicit any investment. Although all efforts are made in order to ensure that the information is correct, no guarantee is provided for the accuracy of any content on this website. Any decision made shall be the responsibility of the investor and Myforex does not take any responsibility whatsoever regarding the use of any information provided herein.
The content provided on this website belongs to Myforex and, where stated, the relevant licensors. All rights are reserved by Myforex and the relevant licensors, and no content of this website, whether in full or in part, shall be copied or displayed elsewhere without the explicit written permission of the relevant copyright holder. If you wish to use any part of the content provided on this website, please ensure that you contact Myforex.
Myforex uses cookies to improve the convenience and functionality of this website. This website may include cookies not only by us but also by third parties (advertisers, log analysts, etc.) for the purpose of tracking the activities of users. Cookie policy
