Select Language

AUD/JPY Price Analysis: Mild gains prompt building support around 20-day SMA

Breaking news

AUD/JPY Price Analysis: Mild gains prompt building support around 20-day SMA

  • X
  • facebook
  • LINE
  • RSS

  • X
  • facebook
  • LINE
  • RSS
New update 2024.06.18 05:56
AUD/JPY Price Analysis: Mild gains prompt building support around 20-day SMA

update 2024.06.18 05:56

  • The AUD/JPY showed tepid losses on Monday and then recovered, focusing on building support around the 20-day SMA regained last week.
  • Given continued side-ways trading, the pair might move in the 104.00 - 105.00 range.

In Monday's session, the AUD/JPY pair experienced limited losses and then recovered to trade with gains, with attention focused on reinforcing the support at the 20-day Simple Moving Average (SMA), after dipping briefly below 103.60 and then recovering it back. The price recovery above the 104.00 level indicates the robust supportive role played by this SMA, which once served as a barrier to the bulls.

On a daily scale, the Relative Strength Index (RSI) stands flat at 57. This neutral stance indicates a weak buying pressure and that the overall technical outlook remains balanced. Likewise, the Moving Average Convergence Divergence (MACD) continues to show flat red bars, indicating a steady selling momentum.

AUD/JPY daily chart

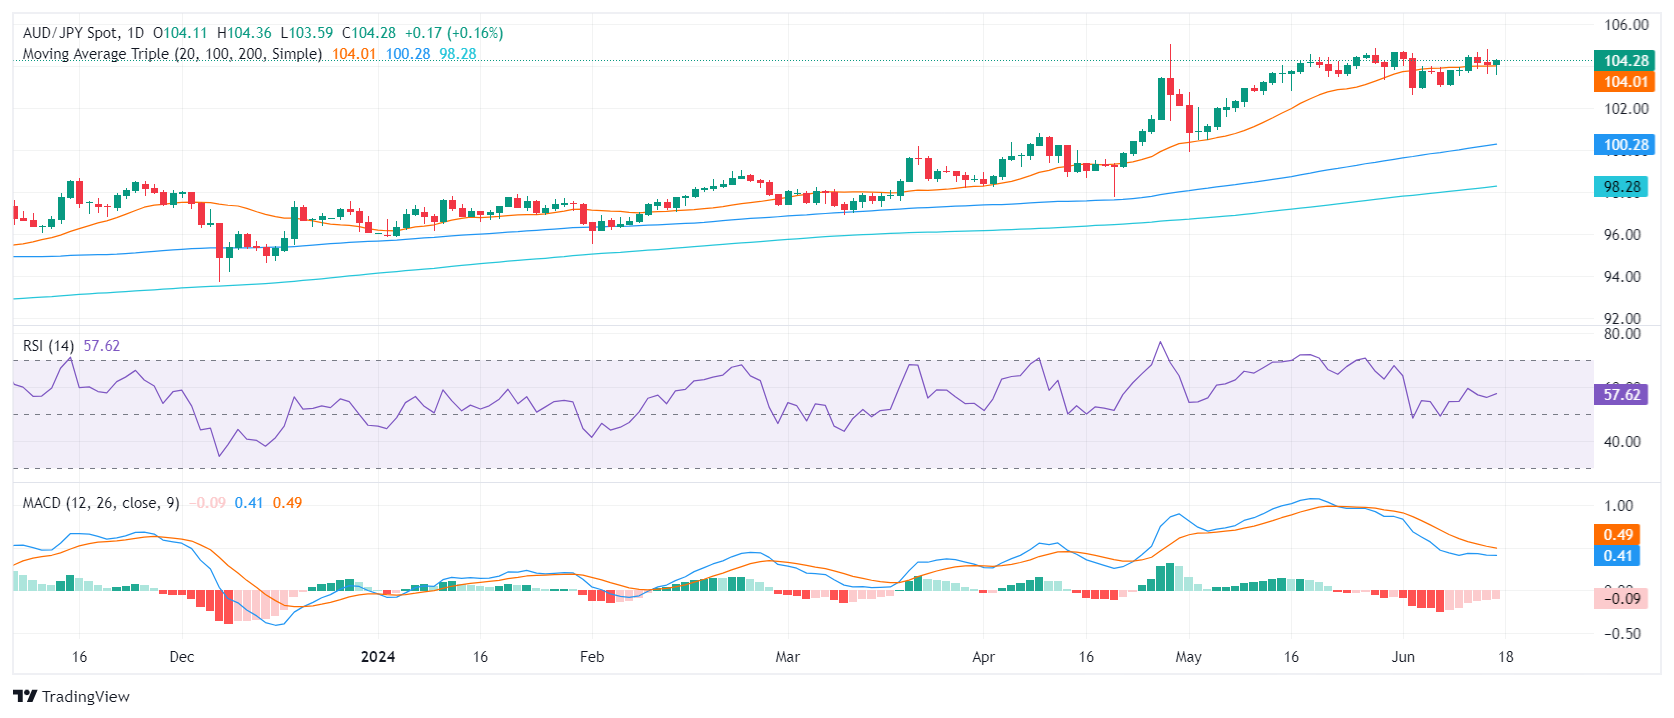
Summing up, ongoing consolidation is the trend for the AUD/JPY pair, despite a small loss on Monday, with trading activity focused around the 20-day SMA. This situation leads to an expectation of continued sideways trading within the 104.00-105.00 range for the forthcoming sessions, as bulls are consolidating the gains from May's rally that took the pair near the 105.00 level.

However, the periods of consolidation suggest a prep phase for bulls aiming for the 104.50-105.00 range once again. On the other hand, a breach below the 20-day SMA could tempt the sellers, with support lining up at 103.60, just below the mentioned SMA. Further supports exist at 102.60, and long-term at the 100 and 200-day SMAs, situated in the 100.00 to 98.00 bracket.

AUD/JPY

Overview
Today last price 104.3
Today Daily Change 0.19
Today Daily Change % 0.18
Today daily open 104.11
 
Trends
Daily SMA20 104
Daily SMA50 102.41
Daily SMA100 100.22
Daily SMA200 98.23
 
Levels
Previous Daily High 104.8
Previous Daily Low 103.64
Previous Weekly High 104.8
Previous Weekly Low 103.08
Previous Monthly High 104.87
Previous Monthly Low 99.93
Daily Fibonacci 38.2% 104.09
Daily Fibonacci 61.8% 104.36
Daily Pivot Point S1 103.57
Daily Pivot Point S2 103.02
Daily Pivot Point S3 102.41
Daily Pivot Point R1 104.73
Daily Pivot Point R2 105.35
Daily Pivot Point R3 105.89


Date

Created

 : 2024.06.18

Update

Last updated

 : 2024.06.18

Related articles


Show more

FXStreet

Financial media

arrow
FXStreet

FXStreet is a forex information website, delivering market analysis and news articles 24/7.
It features a number of articles contributed by well-known analysts, in addition to the ones by its editorial team.
Founded in 2000 by Francesc Riverola, a Spanish economist, it has grown to become a world-renowned information website.

Was this article helpful?

We hope you find this article useful. Any comments or suggestions will be greatly appreciated.  
We are also looking for writers with extensive experience in forex and crypto to join us.

please contact us at [email protected].

Thank you for your feedback.

Most viewed

USD/JPY: The pair visits a 37y high - OCBC

USD/JPY rises to 37y high of 160.87 overnight. Next resistance is at 161.20, OCBC analysts Frances Cheung and Christopher Wong note.
New
update2024.06.28 00:52

EUR/USD: 2-way risks persist - OCBC

EUR slipped overnight but losses remain confined to recent range, OCBC analysts Frances Cheung and Christopher Wong note.
New
update2024.06.28 00:31

DXY: Bullish momentum on daily chart intact - OCBC

The Dollar Index (DXY) rose, taking cues from higher UST yields and the run-up in USD/JPY above 160-mark.
New
update2024.06.28 00:28

GBP/USD Price Analysis: Remain bearish despite bouncing off weekly lows

The Pound Sterling gathers some steam versus the Greenback, yet it remains trading below the weekly highs of 1.2703 as investors await the US Personal Consumption Expenditure (PCE) Price Index release, along with fears of the upcoming general election in the UK.
New
update2024.06.27 23:58

XAU/USD longs may shrink on weak PCE data - TDS

Precious metals are on the front foot despite the mixed bag of economic data this morning, commodity analysts at TD Securities note.
New
update2024.06.27 23:46

NZD/USD undergoing a throwback after piercing neckline

NZD/USD has formed a complex multi-peak topping pattern which is at risk of breaking down now that the pair's "neckline" - the level underpinning its trough lows - at around 0.6100, has been decisively pierced.
New
update2024.06.27 23:36

Silver Price Forecast: XAG/USD bounces back above $29 with US Inflation under spotlight

Silver price (XAG/USD) recovers sharply from a six-week low of $28.60 in Thursday's New York session.
New
update2024.06.27 23:26

Oil: DOE reports increase in crude inventories - TDS

Oil markets are holding steady despite the surprise increase in crude inventories reported by the U.S.
New
update2024.06.27 23:21

Fed's Bostic: Interest rate cut likely in Q4

Atlanta Federal Reserve President Raphael Bostic said on Thursday that an interest rate cut in the fourth quarter was likely, with inflation moving in the right direction, per Reuters.
New
update2024.06.27 23:13

XAU/USD longs may shrink on weak PCE data - TDS

Precious metals are on the front foot despite the mixed bag of economic data this morning, commodity analysts at TD Securities note.
New
update2024.06.27 23:04

Disclaimer:arw

All information and content provided on this website is provided for informational purposes only and is not intended to solicit any investment. Although all efforts are made in order to ensure that the information is correct, no guarantee is provided for the accuracy of any content on this website. Any decision made shall be the responsibility of the investor and Myforex does not take any responsibility whatsoever regarding the use of any information provided herein.

The content provided on this website belongs to Myforex and, where stated, the relevant licensors. All rights are reserved by Myforex and the relevant licensors, and no content of this website, whether in full or in part, shall be copied or displayed elsewhere without the explicit written permission of the relevant copyright holder. If you wish to use any part of the content provided on this website, please ensure that you contact Myforex.

  • Facebook
  • Twitter
  • LINE

Myforex uses cookies to improve the convenience and functionality of this website. This website may include cookies not only by us but also by third parties (advertisers, log analysts, etc.) for the purpose of tracking the activities of users. Cookie policy

I agree
share
Share
Cancel