Select Language

EUR/JPY Price Analysis: Bears lose ground and bulls reclaim the 20-day SMA

Breaking news

EUR/JPY Price Analysis: Bears lose ground and bulls reclaim the 20-day SMA

  • X
  • facebook
  • LINE
  • RSS

  • X
  • facebook
  • LINE
  • RSS
New update 2024.05.08 05:07
EUR/JPY Price Analysis: Bears lose ground and bulls reclaim the 20-day SMA

update 2024.05.08 05:07

  • Despite the red flag hinted by the negative territory of the daily MACD, the buying momentum continues to strengthen.
  • The hourly RSI and MACD reveal a consolidation phase in the market, indicating a temporary balance between buyers and sellers.
  • The short-term outlook now favors the bulls as sellers failed to consolidate below the 20-day SMA.

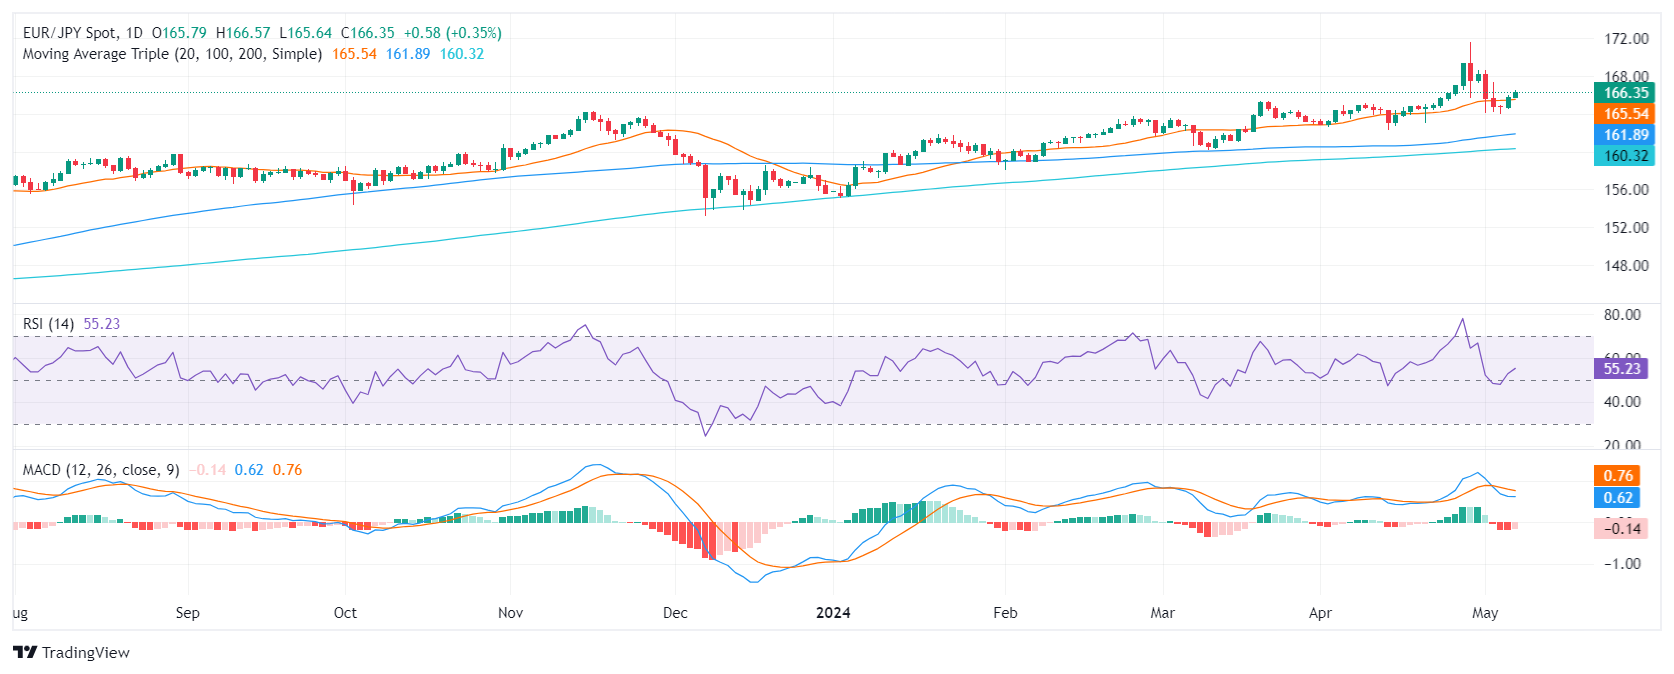
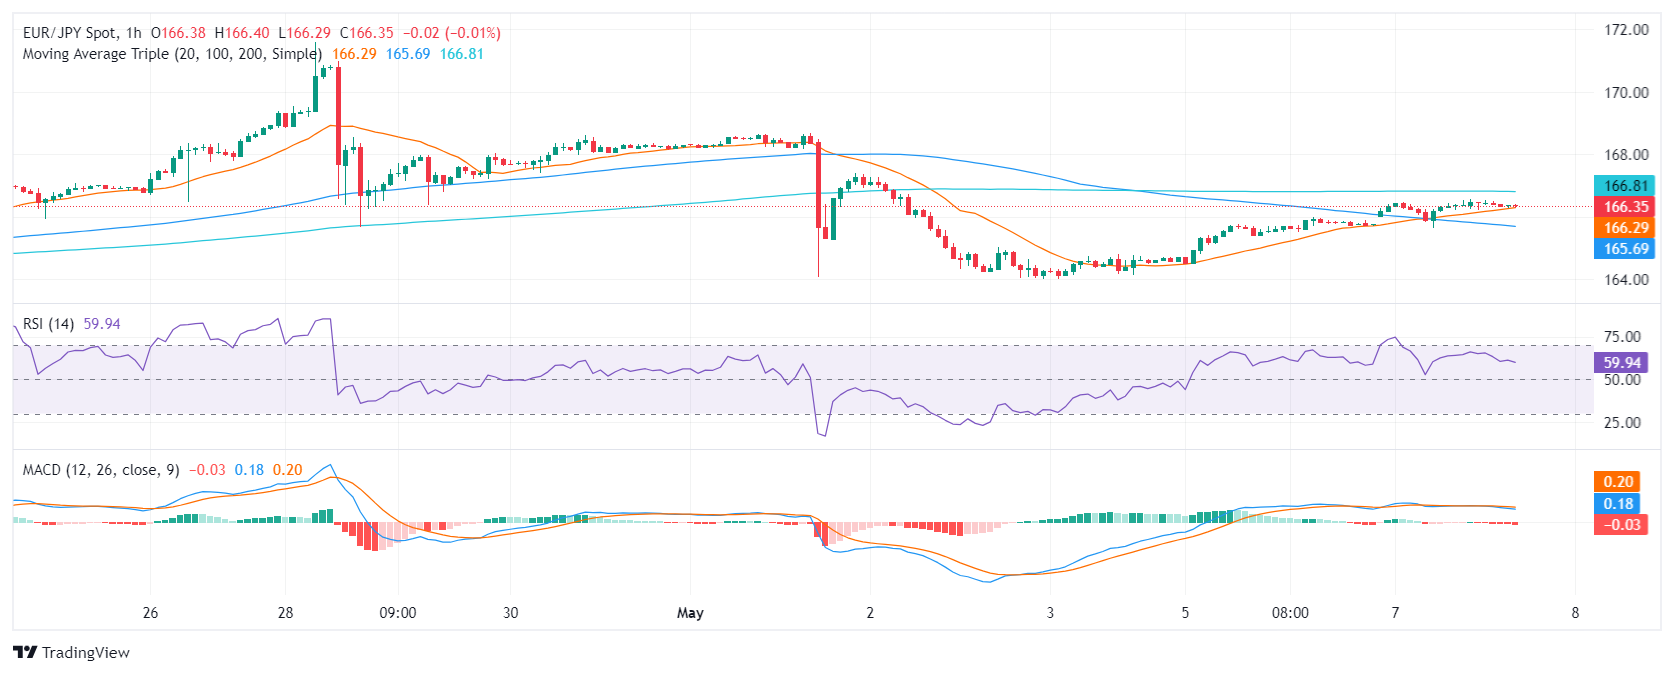
On Tuesday, the EURJPY rose by 0.36% to 166.35, and successfully secured a position above the key 20-day Simple Moving Average (SMA), alluding to the prevailing power of the bulls in the current market. Indicators on the daily chart improved while buyers seem to be consolidating gains on the hourly chart..

On the daily chart, the Relative Strength Index (RSI) for EUR/JPY displays a positive trend. The RSI's recovery from below 50 to 59, is forming a mildly bullish picture.  In addition, the Moving Average Convergence Divergence (MACD) shows a weak selling traction, with falling red bars.

EUR/JPY daily chart

The hourly chart, comparatively, tells a slightly different story. The hourly RSI shows some fluctuating movement, straddling the positive domain. The most recent reading of 59 suggests a balance between buyers and sellers. This relatively flat RSI level suggests a consolidation phase. However, the MACD histogram remains stationary, printing flat red bars and emphasizing the lack of strong momentum on either side of the market.

EUR/JPY hourly chart

From a broader market perspective, EUR/JPY has exhibited a strong bullish posture. The pair has ascended above its 20-day Simple Moving Average (SMA), reinforcing the trend as it also stands above the 100 and 200-day SMAs.

To summarize, while the daily RSI suggests strength among buyers, the stagnant hourly RSI and the stable, negative MACD indicate the market's current standstill or consolidation. Nevertheless, the positioning of SMAs underlines a strong bullish momentum in the short-to-long-term scenario for EUR/JPY. If buyers secure the regained 20-day SMA, the cross may be poised to retest the cycle highs above 171.00.

EUR/JPY

Overview
Today last price 166.34
Today Daily Change 0.56
Today Daily Change % 0.34
Today daily open 165.78
 
Trends
Daily SMA20 165.46
Daily SMA50 164.03
Daily SMA100 161.8
Daily SMA200 160.28
 
Levels
Previous Daily High 165.99
Previous Daily Low 164.48
Previous Weekly High 171.6
Previous Weekly Low 164.02
Previous Monthly High 171.6
Previous Monthly Low 162.28
Daily Fibonacci 38.2% 165.41
Daily Fibonacci 61.8% 165.06
Daily Pivot Point S1 164.84
Daily Pivot Point S2 163.91
Daily Pivot Point S3 163.33
Daily Pivot Point R1 166.35
Daily Pivot Point R2 166.92
Daily Pivot Point R3 167.86


Date

Created

 : 2024.05.08

Update

Last updated

 : 2024.05.08

Related articles


Show more

FXStreet

Financial media

arrow
FXStreet

FXStreet is a forex information website, delivering market analysis and news articles 24/7.
It features a number of articles contributed by well-known analysts, in addition to the ones by its editorial team.
Founded in 2000 by Francesc Riverola, a Spanish economist, it has grown to become a world-renowned information website.

Was this article helpful?

We hope you find this article useful. Any comments or suggestions will be greatly appreciated.  
We are also looking for writers with extensive experience in forex and crypto to join us.

please contact us at [email protected].

Thank you for your feedback.

Most viewed

NZD/USD Price Analysis: Bulls assert dominance, closes its best week of 2024

In Friday's session, the NZD/USD rose to the 0.6137 level, demonstrating a strong bullish trend.
New
update2024.05.18 07:06

USD/JPY Price Analysis: Extends gains but remains below 156.00

The USD/JPY extended its gains late on Friday's North American session, though it's set to finish the week unchanged.
New
update2024.05.18 05:44

WTI pushes into fresh weekly high late Friday as Crude oil recovers ground

West Texas Intermediate (WTI) rose in late-day bidding on Friday as Crude Oil markets recover, but still remains within recent consolidation levels.
New
update2024.05.18 05:31

USD/THB plunges and approaches the 100-day SMA, USD cushioned by Fed officials

The USD/THB continued to lose ground on Friday despite the cautious tone seen in the latest Federal Reserve (Fed) officials' words.
New
update2024.05.18 04:52

Gold price surges above $2,400, eyeing all-time highs

Gold's price skyrocketed during the North American session ahead of the weekend as XAU/USD traded above $2,400, posting gains of more than 1.5% amid higher US Treasury bond yields.
New
update2024.05.18 04:27

Dow Jones Industrial Average adrift on quiet Friday volumes

The Dow Jones Industrial Average (DJIA) is on the high side as markets wind down a hectic trading week that saw rate cut hopes return to the forefront after US Consumer Price Index (CPI) inflation eased to a three-month low.
New
update2024.05.18 03:12

USD/NOK with light losses on quiet Friday, cautious Fed supports the USD

The USD/NOK stands mildly down on Friday with the Greenback holding its ground thanks to the cautious tone of the Federal Reserve (Fed) officials.
New
update2024.05.18 03:05

Canadian Dollar sticks to the middle on tepid Friday

The Canadian Dollar (CAD) is trading softly on a low-volatility Friday, sticking close to the midrange.
New
update2024.05.18 02:33

Mexican Peso hits four-week high on hawkish Banxico remarks

The Mexican Peso continues to record gains versus the US Dollar, refreshing its four-week high as the rally continued.
update2024.05.18 02:25

US Dollar stands neutral as Fed officials remain cautious

The US Dollar Index (DXY) is currently trading at 104.50, maintaining a neutral stance.
update2024.05.18 01:47

Disclaimer:arw

All information and content provided on this website is provided for informational purposes only and is not intended to solicit any investment. Although all efforts are made in order to ensure that the information is correct, no guarantee is provided for the accuracy of any content on this website. Any decision made shall be the responsibility of the investor and Myforex does not take any responsibility whatsoever regarding the use of any information provided herein.

The content provided on this website belongs to Myforex and, where stated, the relevant licensors. All rights are reserved by Myforex and the relevant licensors, and no content of this website, whether in full or in part, shall be copied or displayed elsewhere without the explicit written permission of the relevant copyright holder. If you wish to use any part of the content provided on this website, please ensure that you contact Myforex.

  • Facebook
  • Twitter
  • LINE

Myforex uses cookies to improve the convenience and functionality of this website. This website may include cookies not only by us but also by third parties (advertisers, log analysts, etc.) for the purpose of tracking the activities of users. Cookie policy

I agree
share
Share
Cancel