Select Language

NZD/USD Price Analysis: Short-term uptrend hinted, buyers might take some profits

Breaking news

NZD/USD Price Analysis: Short-term uptrend hinted, buyers might take some profits

  • X
  • facebook
  • LINE
  • RSS

  • X
  • facebook
  • LINE
  • RSS
New update 2024.05.03 04:50
NZD/USD Price Analysis: Short-term uptrend hinted, buyers might take some profits

update 2024.05.03 04:50

  • The daily RSI shows minor buying traction, further validation is needed.
  • The hourly chart reveals growing buying momentum with RSI hitting overbought terrain.
  • Buyers finally recovered the 20-day SMA, which brightens the outlook for the short term.

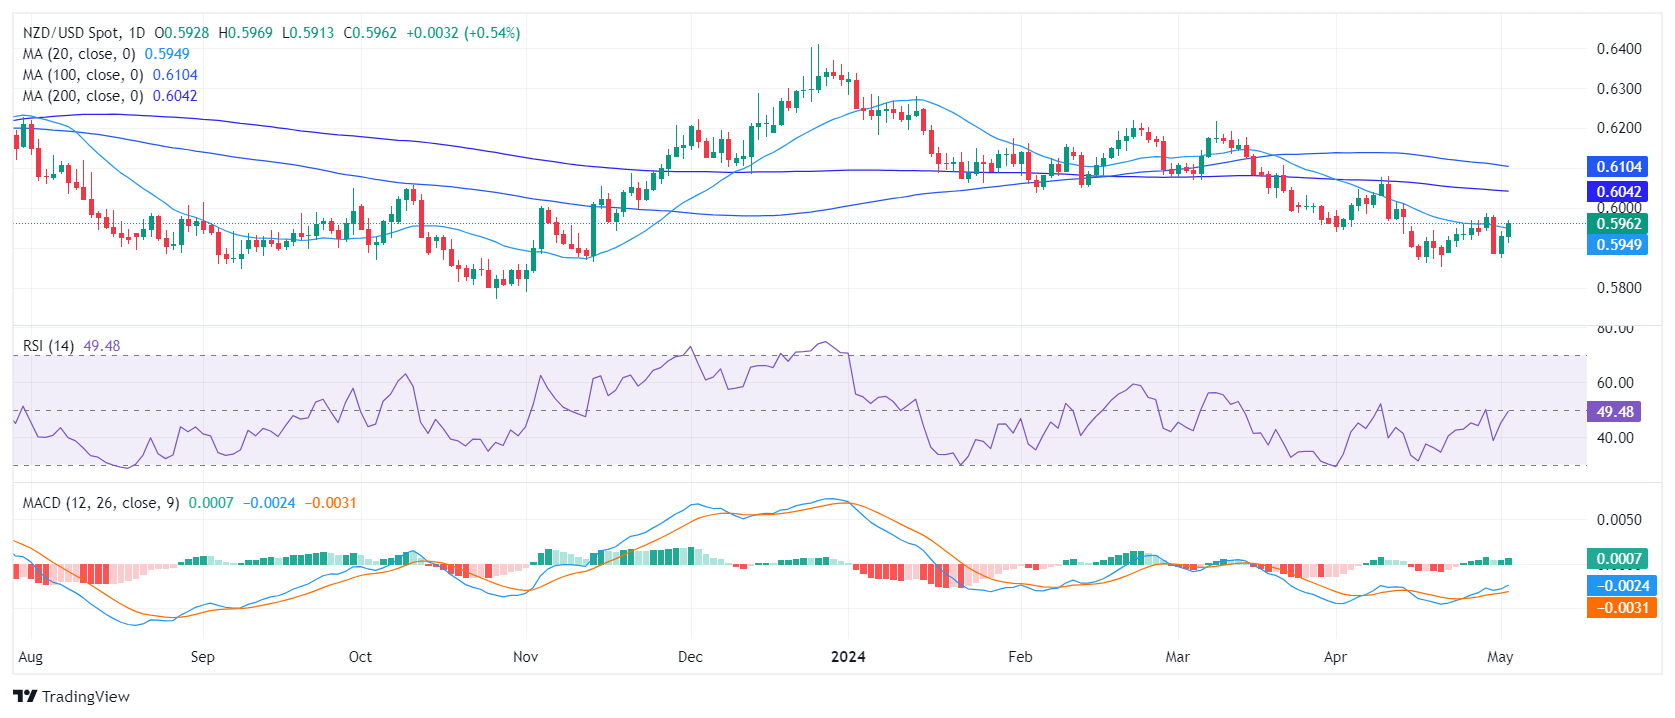
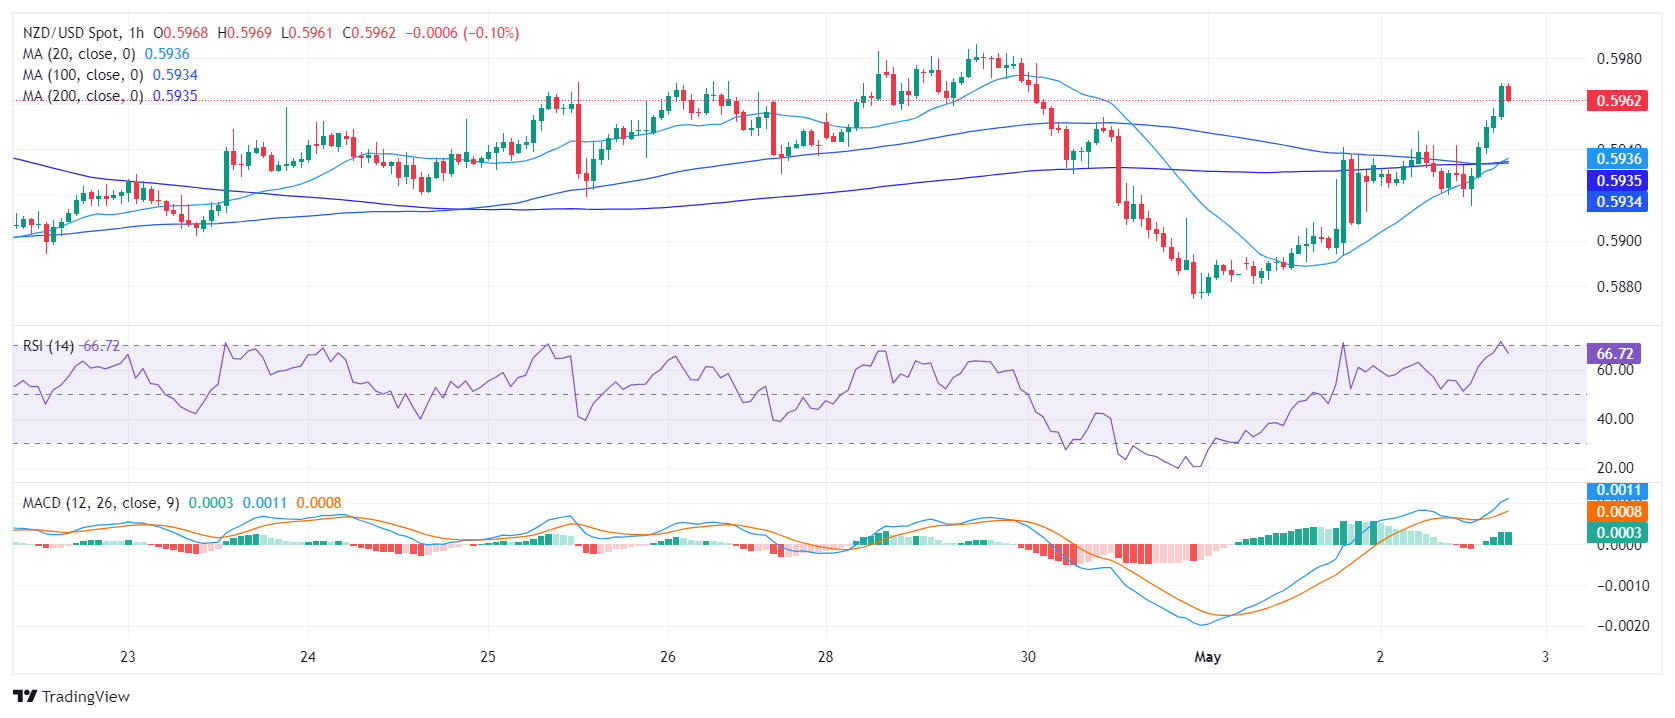
The NZD/USD rose to 0.5961, displaying a rally of 0.56% and jumping above the key short-term 20-day Simple Moving Average (SMA) on Thursday which now indicates a potential bullish bias. However, the broader trend remains bearish. With the intense increase in buying traction on an hourly scale, buyers might take some profits ahead of the Asian session.

On the daily chart, the Relative Strength Index (RSI) stands just above negative territory threshold, hinting at a slight uptrend. However, this inconclusive signal requires further validation to be considered a bullish flag.

NZD/USD daily chart

On the hourly chart, the RSI is at 66 slightly down after hitting the overbought threshold. This indicates a stronger short-term buying momentum but that the pair may start to consolidate ahead of Friday's session. Furthermore, the Moving Average Convergence Divergence (MACD) presents green bars, showing positive momentum.

NZD/USD hourly chart

Considering broader market movements, the NZD/USD's jump above the 20-day Simple Moving Average (SMA), signify a potential short-term upward trend. However, the pair still lingers below the 100 and 200-day SMA, implying sustained selling pressure and a bearish market bias long-term. That being said, bulls are making arguments to be considered seriously and will start to set their sight at the 100-day SMA at 0.6100.


NZD/USD

Overview
Today last price 0.596
Today Daily Change 0.0030
Today Daily Change % 0.51
Today daily open 0.593
 
Trends
Daily SMA20 0.5952
Daily SMA50 0.6031
Daily SMA100 0.6106
Daily SMA200 0.6043
 
Levels
Previous Daily High 0.5941
Previous Daily Low 0.5875
Previous Weekly High 0.597
Previous Weekly Low 0.5886
Previous Monthly High 0.6079
Previous Monthly Low 0.5851
Daily Fibonacci 38.2% 0.5916
Daily Fibonacci 61.8% 0.59
Daily Pivot Point S1 0.5889
Daily Pivot Point S2 0.5849
Daily Pivot Point S3 0.5823
Daily Pivot Point R1 0.5956
Daily Pivot Point R2 0.5981
Daily Pivot Point R3 0.6022


Date

Created

 : 2024.05.03

Update

Last updated

 : 2024.05.03

Related articles


Show more

FXStreet

Financial media

arrow
FXStreet

FXStreet is a forex information website, delivering market analysis and news articles 24/7.
It features a number of articles contributed by well-known analysts, in addition to the ones by its editorial team.
Founded in 2000 by Francesc Riverola, a Spanish economist, it has grown to become a world-renowned information website.

Was this article helpful?

We hope you find this article useful. Any comments or suggestions will be greatly appreciated.  
We are also looking for writers with extensive experience in forex and crypto to join us.

please contact us at [email protected].

Thank you for your feedback.

Most viewed

AUD/JPY remains below 104.00 after mixed economic data from China

AUD/JPY hovers around 103.70 during the European trading hours on Friday.
New
update2024.05.17 17:50

Silver price today: Silver rises, according to FXStreet data

Silver prices (XAG/USD) rose on Friday, according to FXStreet data.
New
update2024.05.17 17:45

India Gold price today: Gold falls, according to MCX data

Gold prices fell in India on Friday, according to data from India's Multi Commodity Exchange (MCX).
New
update2024.05.17 17:43

FX option expiries for May 17 NY cut

FX option expiries for May 17 NY cut at 10:00 Eastern Time, via DTCC, can be found below - EUR/USD: EUR amounts 1.0675 753m 1.0725 652m 1.0740 494m 1.0775 825m 1.0800 601m 1.0810 813m 1.0820 685m 1.0825 500m 1.0850 3b 1.0875 1.2b 1.0915 1.1b - GBP/USD: GBP amounts 1.2475 550m - USD/CHF: USD amounts 0.9000 605m - USD/CAD: USD amounts 1.3600 508m 1.3675 887m 1.3725 924m 1.3735 585m - USD/JPY: USD amounts 152.50 1.1b 153.60 842m 154.00 2b 154.80 500m 155.00 2b 155.50 891m 156.00 791m 156.35 538m 156.60 475m
New
update2024.05.17 17:36

USD/CHF advances toward 0.9100 due to lower Swiss Industrial Production

USD/CHF extends its gains for the second day, trading around 0.9080 during the early European hours on Friday.
New
update2024.05.17 17:25

Pound Sterling holds strength near 1.2700 although US Dollar stabilizes

The Pound Sterling (GBP) turns sideways in Friday's London session after posting a fresh monthly high at 1.2700 on Thursday.
New
update2024.05.17 17:09

Mexican Peso consolidates after rally

The Mexican Peso (MXN) trades broadly unchanged in its key pairs on Friday, with USD/MXN flatlining as the US Dollar (USD) stabilizes after its recent sell-off and market sentiment remains relatively calm heading into the weekend.
New
update2024.05.17 16:39

Forex Today: More Fedspeak on the agenda heading into the weekend

Here is what you need to know on Friday, May 17: Following the sharp decline seen after April inflation data on Wednesday, the US Dollar Index managed to stage a modest rebound on Thursday and closed the day in positive territory.
New
update2024.05.17 15:59

EUR/JPY Price Analysis: Extends its upside, the next hurdle is seen at 169.40

The EUR/JPY cross extends the rally around 169.20 during the early European trading hours on Friday.
New
update2024.05.17 15:35

Silver Price Forecast: XAG/USD rises toward $30.00 after higher US Jobless Claims

Silver price retraces its recent losses registered on Thursday, trading around $29.70 per troy ounce during the Asian hours on Friday.
New
update2024.05.17 15:33

Disclaimer:arw

All information and content provided on this website is provided for informational purposes only and is not intended to solicit any investment. Although all efforts are made in order to ensure that the information is correct, no guarantee is provided for the accuracy of any content on this website. Any decision made shall be the responsibility of the investor and Myforex does not take any responsibility whatsoever regarding the use of any information provided herein.

The content provided on this website belongs to Myforex and, where stated, the relevant licensors. All rights are reserved by Myforex and the relevant licensors, and no content of this website, whether in full or in part, shall be copied or displayed elsewhere without the explicit written permission of the relevant copyright holder. If you wish to use any part of the content provided on this website, please ensure that you contact Myforex.

  • Facebook
  • Twitter
  • LINE

Myforex uses cookies to improve the convenience and functionality of this website. This website may include cookies not only by us but also by third parties (advertisers, log analysts, etc.) for the purpose of tracking the activities of users. Cookie policy

I agree
share
Share
Cancel