Select Language

USD/CHF Price Analysis: Extends the rally above 0.9200  amid the overbought condition

Breaking news

USD/CHF Price Analysis: Extends the rally above 0.9200  amid the overbought condition

  • X
  • facebook
  • LINE
  • RSS

  • X
  • facebook
  • LINE
  • RSS
New update 2024.05.01 14:16
USD/CHF Price Analysis: Extends the rally above 0.9200  amid the overbought condition

update 2024.05.01 14:16

  • USD/CHF trades on a stronger note around 0.9210 ahead of the Fed rate decision on Wednesday.
  • The pair keeps the bullish vibe with the overbought RSI condition.
  • The first upside barrier is seen at 0.9245; the initial support level is located at 0.9155.

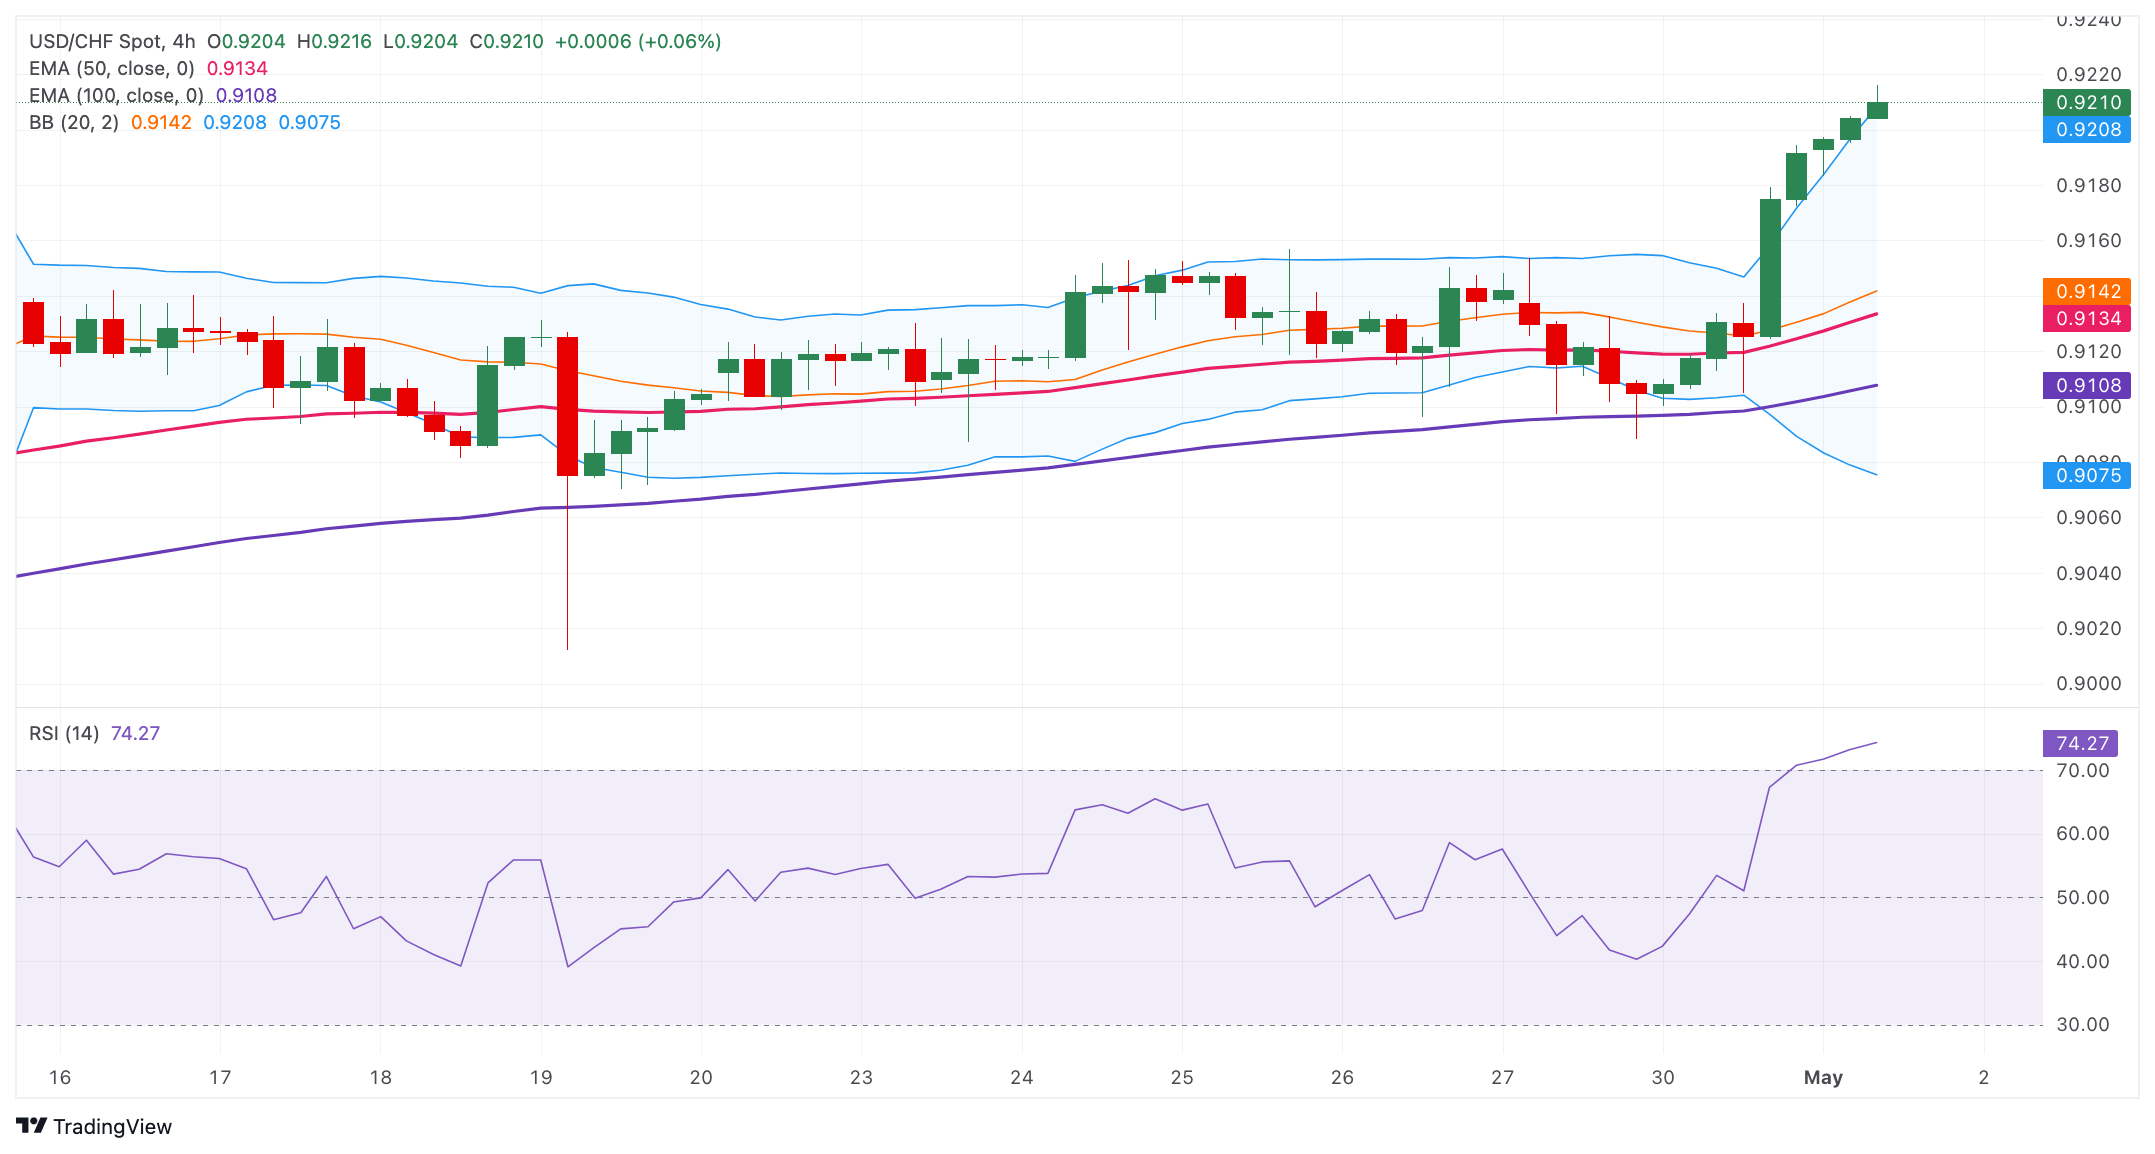
The USD/CHF pair extends its upside to 0.9210 on Wednesday during the early European session. A renewed US Dollar (USD) demand creates a tailwind to a major pair. Furthermore, the Fed is widely expected to keep the policy rate in its current 5.25%-5.50% range on Wednesday and continue to maintain the hawkish stance, which provides some support to the Greenback. 

Technically, USD/CHF maintains the bullish outlook unchanged on the four-hour chart as the cross is above the key 50- and 100-period Exponential Moving Averages (EMAs). The Relative Strength Index (RSI) holds in bullish territory above the midline. However, the overbought RSI condition indicates that further consolidation cannot be ruled out before positioning for any near-term USD/CHF appreciation. 

A decisive break above the upper boundary of the Bollinger Band at 0.9210 will see a rally to a high of October 3, 2023, at 0.9245. Any follow-through buying above this level will expose the 0.9300 psychological round mark. The next upside target is seen at a high of March 16, 2023, at 0.9340. 

On the flip side, the initial support level for the cross will emerge near a high of April 29 at 0.9155. The additional downside filter to watch is the 50-period EMA at 0.9134. The key contention level is located at the 0.9100-0.9110 zone, representing the psychological figure and the 100-period EMA. A breach of the mentioned level will see a drop to the lower limit of the Bollinger Band at 0.9075. 

USD/CHF four-hour chart

USD/JPY

Overview
Today last price 157.86
Today Daily Change 0.06
Today Daily Change % 0.04
Today daily open 157.8
 
Trends
Daily SMA20 154.19
Daily SMA50 151.73
Daily SMA100 148.86
Daily SMA200 148.22
 
Levels
Previous Daily High 157.85
Previous Daily Low 156.06
Previous Weekly High 158.44
Previous Weekly Low 154.46
Previous Monthly High 160.32
Previous Monthly Low 150.81
Daily Fibonacci 38.2% 157.17
Daily Fibonacci 61.8% 156.74
Daily Pivot Point S1 156.63
Daily Pivot Point S2 155.45
Daily Pivot Point S3 154.84
Daily Pivot Point R1 158.41
Daily Pivot Point R2 159.03
Daily Pivot Point R3 160.2


Date

Created

 : 2024.05.01

Update

Last updated

 : 2024.05.01

Related articles


Show more

FXStreet

Financial media

arrow
FXStreet

FXStreet is a forex information website, delivering market analysis and news articles 24/7.
It features a number of articles contributed by well-known analysts, in addition to the ones by its editorial team.
Founded in 2000 by Francesc Riverola, a Spanish economist, it has grown to become a world-renowned information website.

Was this article helpful?

We hope you find this article useful. Any comments or suggestions will be greatly appreciated.  
We are also looking for writers with extensive experience in forex and crypto to join us.

please contact us at [email protected].

Thank you for your feedback.

Most viewed

Silver Price Analysis: Reaches a technical crossroads

Silver (XAG/USD) price is consolidating in the $31.60s on Tuesday after pulling back from Monday's eleven-year high of $32.51.
New
update2024.05.21 20:20

Fed policymakers take on a cautious language on policy outlook

Federal Reserve (Fed) policymakers are scheduled to deliver speeches throughout this week as investors reassess the interest rate outlook following the April Consumer Price Index (CPI) data.
New
update2024.05.21 20:13

US Dollar looking for direction as slew of Federal Reserve officials are set to speak

The US Dollar (USD) is afloat on Tuesday, holding around 104.50 as measured by the US Dollar Index (DXY), with no clear direction visible for the week after the standstill performance on Monday.
New
update2024.05.21 20:00

Oil eases further after string of technical rejections

Oil prices edge lower and trade around $78.50 on Tuesday, testing market belief and support for further upside. Traders are not hanging any weight or importance of risk on the two main
New
update2024.05.21 19:30

AUD/USD recovers intraday losses in the aftermath of RBA minutes

The AUD/USD pair rebounds from the intraday low of 0.6650 in Tuesday's European session.
New
update2024.05.21 19:21

Gold pulls back after touching a new all-time high

Gold price (XAU/USD) retreats to the $2,410s on Tuesday as commentary from central bank policymakers around the globe reveals a reluctance to commit to lowering interest rates.
New
update2024.05.21 19:12

EUR/USD juggles as Fed officials support higher for longer interest rates

EUR/USD is stuck in a tight range near 1.0850 in Tuesday's European session.
New
update2024.05.21 18:37

Silver price today: Silver falls, according to FXStreet data

Silver prices (XAG/USD) fell on Tuesday, according to FXStreet data.
New
update2024.05.21 18:03

AUD/JPY trades around 104.00 after snapping its winning streak amid risk aversion

The AUD/JPY pair snapped its six-day winning streak, trading around 104.00 during the European session on Tuesday, likely influenced by a general risk aversion sentiment.
New
update2024.05.21 18:01

India Gold price today: Gold rallies, according to MCX data

Gold prices rose in India on Tuesday, according to data from India's Multi Commodity Exchange (MCX).
New
update2024.05.21 17:58

Disclaimer:arw

All information and content provided on this website is provided for informational purposes only and is not intended to solicit any investment. Although all efforts are made in order to ensure that the information is correct, no guarantee is provided for the accuracy of any content on this website. Any decision made shall be the responsibility of the investor and Myforex does not take any responsibility whatsoever regarding the use of any information provided herein.

The content provided on this website belongs to Myforex and, where stated, the relevant licensors. All rights are reserved by Myforex and the relevant licensors, and no content of this website, whether in full or in part, shall be copied or displayed elsewhere without the explicit written permission of the relevant copyright holder. If you wish to use any part of the content provided on this website, please ensure that you contact Myforex.

  • Facebook
  • Twitter
  • LINE

Myforex uses cookies to improve the convenience and functionality of this website. This website may include cookies not only by us but also by third parties (advertisers, log analysts, etc.) for the purpose of tracking the activities of users. Cookie policy

I agree
share
Share
Cancel