
Created
: 2024.04.30


![]() 2024.04.30 18:41
2024.04.30 18:41
The Gold price (XAU/USD) trades lower by one percent on Tuesday, in the $2,310s at the time of writing, as a positive market mood dents safe-haven demand for the precious metal.
Markets in Asia-Pacific closed on the whole in positive territory, with the Nikkie posting a 1.24% gain, Australia's ASX200 up 0.35% and the Hang Seng rising 0.1% at the close.
Although stock markets on mainland China edged lower to close in negative territory, this may have been on the back of traders booking profits ahead of the May 1 holiday after a run of up days. Indeed data out of China was on the whole positive, showing that the Caixin Chinese Manufacturing PMI hit a 14-month high in April, whilst in Europe, French and Spanish GDP growth beat estimates in the first quarter.
The Gold price rally in Q1 was driven by a combination of strong central bank and OTC buying, according to a recent report by the World Gold Council (WGC).
Total demand during the period was estimated at 1,238.3 tonnes compared to 1,269.7t in the previous quarter.
Over-the-Counter, or OTC buying - which is not conducted via exchanges and so can only be estimated - rose by 136.4t compared to 126.9t in Q4.
Heavy buying by central banks was a contributing factor in the rally in Gold price, with 289.7t of Gold bought by this market compared to 219.6t in the previous quarter.
"Q1 saw no let-up in the pace of central bank gold buying: 290t (net) was added to official holdings," said the report.
Further details from the WGC report are as follows:
Gold price (XAU/USD) is potentially unfolding the final down wave of a Measured Move price pattern, most clearly visible on the 4-hour chart, which technical analysts use to analyze the short-term trend.
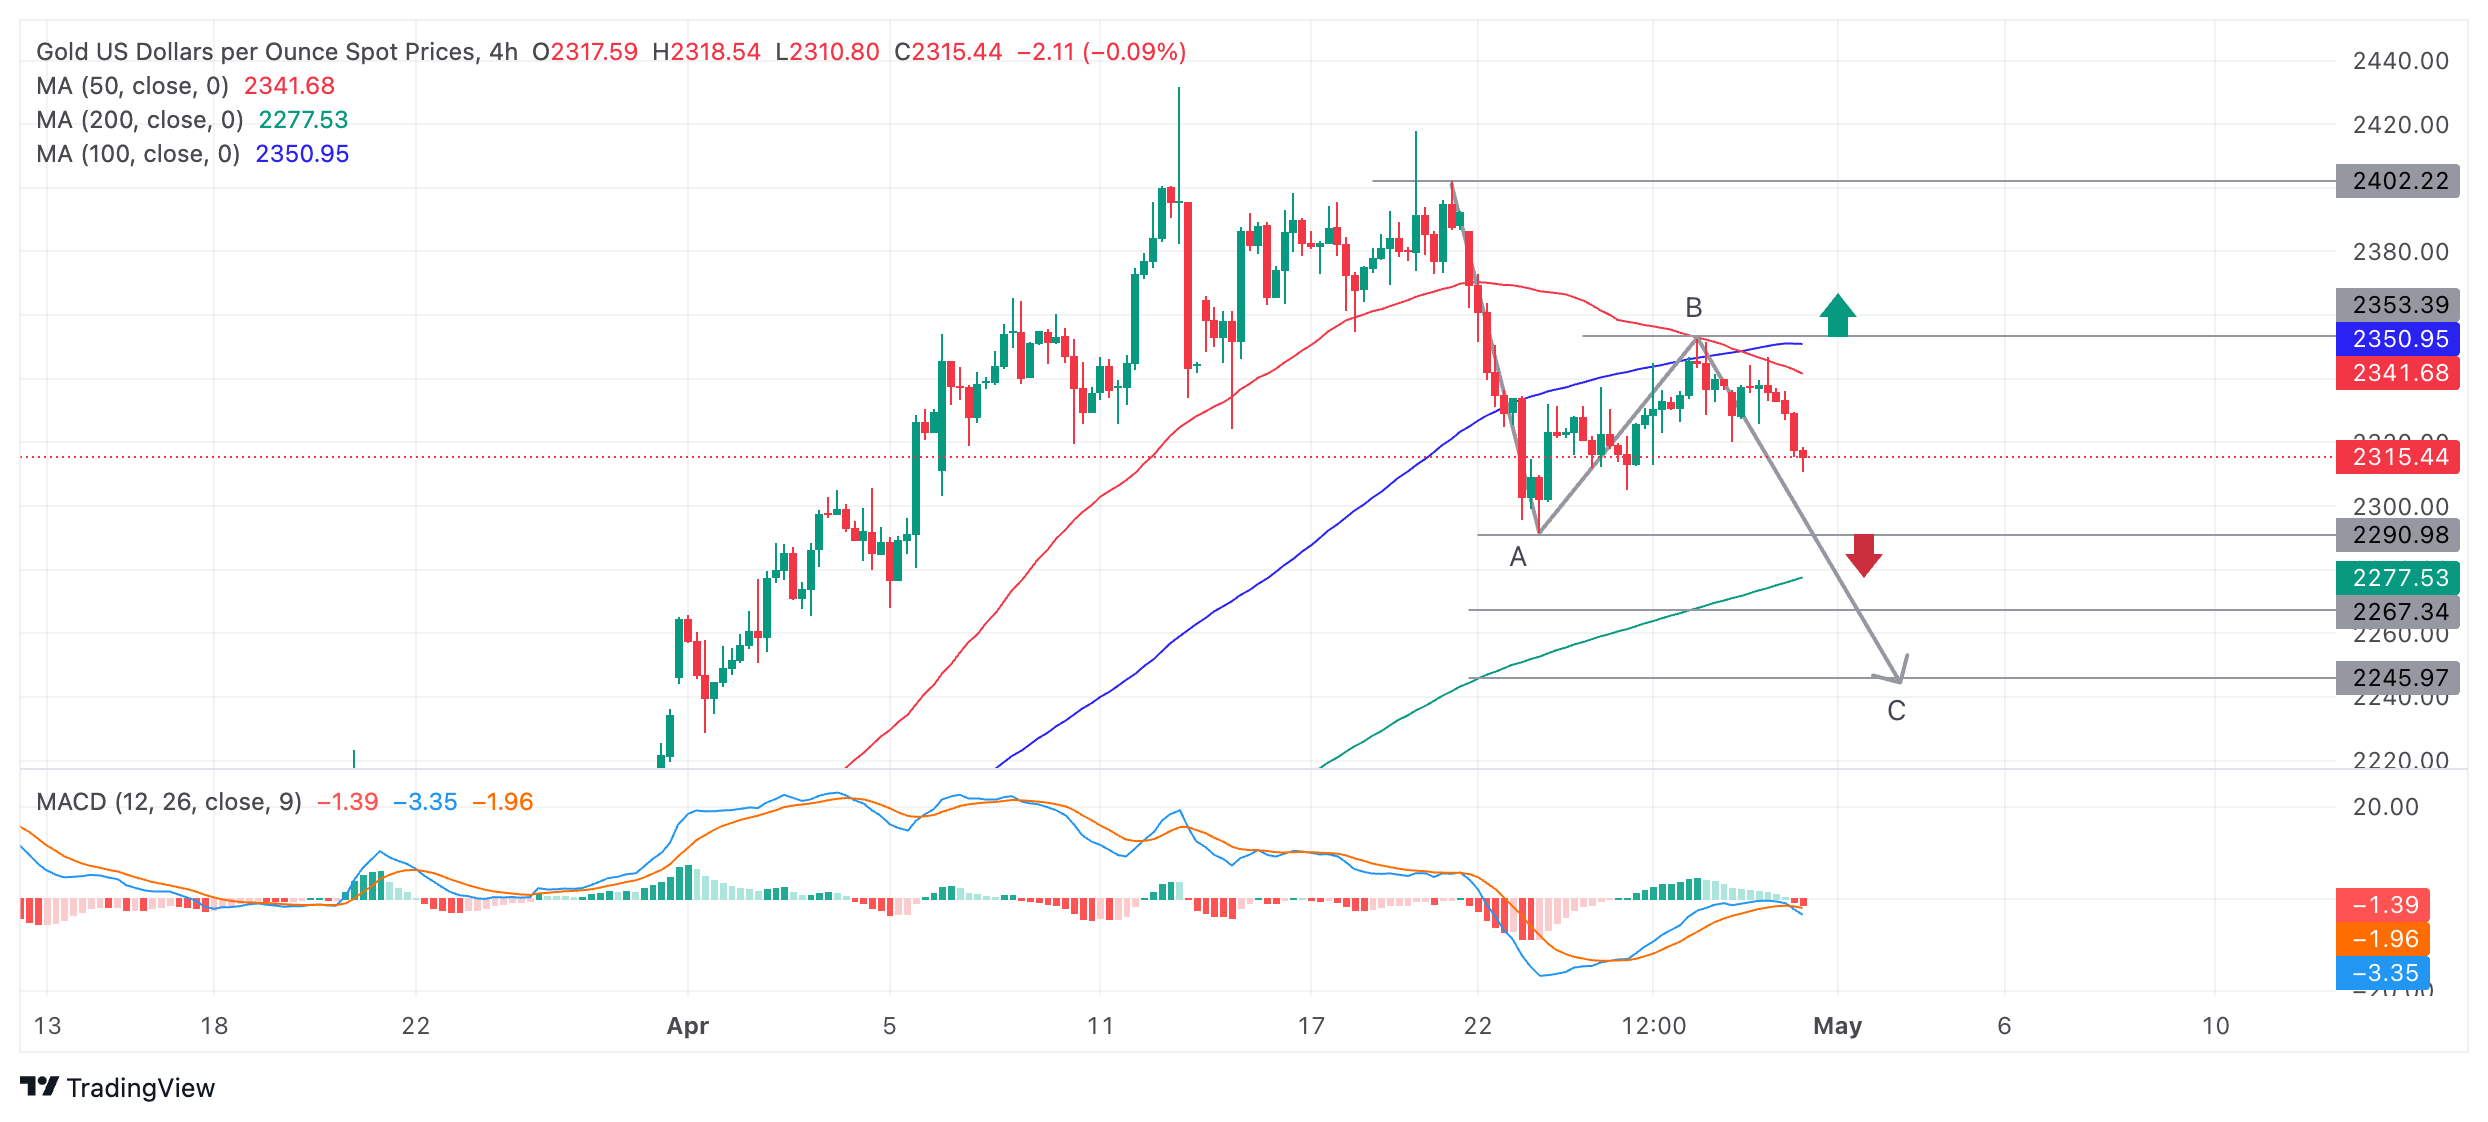
Measured Move patterns are composed of three waves that trace out a zig-zag pattern. The waves are often labeled A, B and C. The end of the final C wave can be estimated based on the length of wave A. It is usually either equal in length to A or a Fibonacci 0.681 ratio of A.
A break below $2,290, however, would confirm the pattern is a Measured Move and lead to more downside as wave C unfolds, with targets at $2,267 (the 0.681 target) and $2,245 (A=C).
The Moving Average Convergence Divergence (MACD) momentum indicator has started printing bearish red histogram bars and has crossed below its signal line lending the chart a negative tone.
Until the pattern is confirmed, however, there is still a chance Gold price could rally. A break above the cluster of Moving Averages and the peak of wave B at $2,350 would potentially usher in a new more bullish environment. This could then see a retest of the $2,400 highs.
Additionally, the trend for Gold price is up both in the medium and long-term, overall supporting the outlook for bulls.
Gold has played a key role in human's history as it has been widely used as a store of value and medium of exchange. Currently, apart from its shine and usage for jewelry, the precious metal is widely seen as a safe-haven asset, meaning that it is considered a good investment during turbulent times. Gold is also widely seen as a hedge against inflation and against depreciating currencies as it doesn't rely on any specific issuer or government.
Central banks are the biggest Gold holders. In their aim to support their currencies in turbulent times, central banks tend to diversify their reserves and buy Gold to improve the perceived strength of the economy and the currency. High Gold reserves can be a source of trust for a country's solvency. Central banks added 1,136 tonnes of Gold worth around $70 billion to their reserves in 2022, according to data from the World Gold Council. This is the highest yearly purchase since records began. Central banks from emerging economies such as China, India and Turkey are quickly increasing their Gold reserves.
Gold has an inverse correlation with the US Dollar and US Treasuries, which are both major reserve and safe-haven assets. When the Dollar depreciates, Gold tends to rise, enabling investors and central banks to diversify their assets in turbulent times. Gold is also inversely correlated with risk assets. A rally in the stock market tends to weaken Gold price, while sell-offs in riskier markets tend to favor the precious metal.
The price can move due to a wide range of factors. Geopolitical instability or fears of a deep recession can quickly make Gold price escalate due to its safe-haven status. As a yield-less asset, Gold tends to rise with lower interest rates, while higher cost of money usually weighs down on the yellow metal. Still, most moves depend on how the US Dollar (USD) behaves as the asset is priced in dollars (XAU/USD). A strong Dollar tends to keep the price of Gold controlled, whereas a weaker Dollar is likely to push Gold prices up.
![]()
Created
: 2024.04.30
![]()
Last updated
: 2024.04.30

FXStreet is a forex information website, delivering market analysis and news articles 24/7.
It features a number of articles contributed by well-known analysts, in addition to the ones by its editorial team.
Founded in 2000 by Francesc Riverola, a Spanish economist, it has grown to become a world-renowned information website.
We hope you find this article useful. Any comments or suggestions will be greatly appreciated.
We are also looking for writers with extensive experience in forex and crypto to join us.
please contact us at [email protected].
Disclaimer:![]()
All information and content provided on this website is provided for informational purposes only and is not intended to solicit any investment. Although all efforts are made in order to ensure that the information is correct, no guarantee is provided for the accuracy of any content on this website. Any decision made shall be the responsibility of the investor and Myforex does not take any responsibility whatsoever regarding the use of any information provided herein.
The content provided on this website belongs to Myforex and, where stated, the relevant licensors. All rights are reserved by Myforex and the relevant licensors, and no content of this website, whether in full or in part, shall be copied or displayed elsewhere without the explicit written permission of the relevant copyright holder. If you wish to use any part of the content provided on this website, please ensure that you contact Myforex.
Myforex uses cookies to improve the convenience and functionality of this website. This website may include cookies not only by us but also by third parties (advertisers, log analysts, etc.) for the purpose of tracking the activities of users. Cookie policy
