Select Language

USD/CAD Price Analysis: Hovers near 1.3700 within the ascending channel

Breaking news

USD/CAD Price Analysis: Hovers near 1.3700 within the ascending channel

  • X
  • facebook
  • LINE
  • RSS

  • X
  • facebook
  • LINE
  • RSS
New update 2024.04.30 18:05
USD/CAD Price Analysis: Hovers near 1.3700 within the ascending channel

update 2024.04.30 18:05

  • USD/CAD could gain ground as technical analysis indicates a recovery of bullish sentiment.
  • A break above 1.3800 could lead the pair to revisit its five-month high of 1.3846.
  • A breach below the channel's lower boundary around 1.3630 could weaken the bullish sentiment.

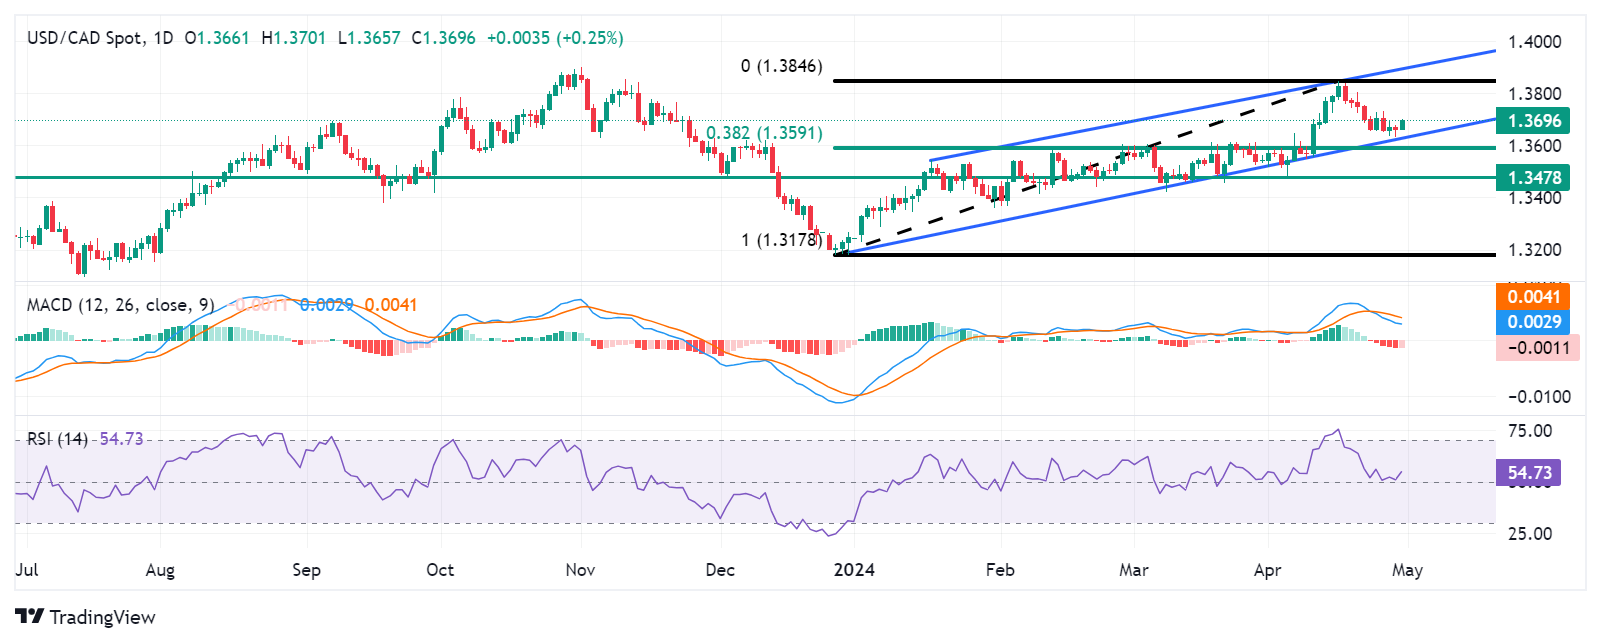
USD/CAD consolidates within the ascending channel on the daily chart, with the 14-day Relative Strength Index (RSI) positioned above 50, indicating a recovery of bullish sentiment. The pair edges higher to near 1.3700 during the European session on Tuesday.

Moreover, the Moving Average Convergence Divergence (MACD) line is above the centerline, signaling bullish momentum, although it remains below the signal line. Traders may look for confirmation from the MACD, a lagging indicator, to ascertain the direction of the trend.

The USD/CAD pair may encounter resistance near the psychological level of 1.3800. A breakthrough above this level could pave the way for the pair to revisit its five-month high of 1.3846, followed by the upper boundary of the ascending channel and the psychological barrier of 1.3900.

On the downside, the USD/CAD pair might test the lower boundary of the channel around the 1.3630 level. A breach below this level could exert downward pressure on the pair, leading it toward the region around the psychological support at 1.3600 and the 38.2% Fibonacci retracement level of 1.3591, plotted between the levels of 1.3178 and 1.3846.

The next significant support level lies at 1.3478, should the USD/CAD pair experience further depreciation, followed by December's low at 1.3178.

USD/CAD: Daily Chart

USD/CAD

Overview
Today last price 1.3697
Today Daily Change 0.0036
Today Daily Change % 0.26
Today daily open 1.3661
 
Trends
Daily SMA20 1.3674
Daily SMA50 1.359
Daily SMA100 1.35
Daily SMA200 1.3544
 
Levels
Previous Daily High 1.3678
Previous Daily Low 1.3632
Previous Weekly High 1.3753
Previous Weekly Low 1.3635
Previous Monthly High 1.3614
Previous Monthly Low 1.342
Daily Fibonacci 38.2% 1.365
Daily Fibonacci 61.8% 1.3661
Daily Pivot Point S1 1.3636
Daily Pivot Point S2 1.3611
Daily Pivot Point S3 1.359
Daily Pivot Point R1 1.3682
Daily Pivot Point R2 1.3703
Daily Pivot Point R3 1.3728


Date

Created

 : 2024.04.30

Update

Last updated

 : 2024.04.30

Related articles


Show more

FXStreet

Financial media

arrow
FXStreet

FXStreet is a forex information website, delivering market analysis and news articles 24/7.
It features a number of articles contributed by well-known analysts, in addition to the ones by its editorial team.
Founded in 2000 by Francesc Riverola, a Spanish economist, it has grown to become a world-renowned information website.

Was this article helpful?

We hope you find this article useful. Any comments or suggestions will be greatly appreciated.  
We are also looking for writers with extensive experience in forex and crypto to join us.

please contact us at [email protected].

Thank you for your feedback.

Most viewed

EUR/GBP drifts below 0.8550 as rate cut expectations weigh on Euro

EUR/GBP dropped further on Monday, receding below 0.8550 as the Euro (EUR) sheds weight against the Pound Sterling (GBP) with the European Central Bank (ECB) stepping closer towards making a first rate cut in June or July.
New
update2024.05.21 06:42

USD/CHF Price Analysis: Breaks 0.9100 with bulls targeting YTD high

On Monday, the USD/CHF registered more than 0.20% gains, with buyers regaining control and achieving a daily close above 0.9100.
New
update2024.05.21 06:41

NZD/USD Price Analysis: Bulls sustain control, intermittent dips may signal healthy corrections

In Monday's session, the NZD/USD stands at 0.6107, revealing a dip of 0.40%.
New
update2024.05.21 06:39

USD/THB sees red on quiet Monday, eyes on May's FOMC minutes

The USD/THB pair is trading mildly down on Monday after falling to a low of 36.05 earlier in the session and managed to clear most of the daily losses.
New
update2024.05.21 05:24

Forex Today: Investors seek fresh clues

What you need to take care of on Tuesday, May 21: Metals grabbed all of the attention on Monday, as Gold and Copper traded at record highs at the beginning of the day, although shed some ground in a quiet European morning, as most local markets were closed due to the celebration of Whit Monday.
New
update2024.05.21 05:00

USD/JPY Price Analysis: Hits three-day high as bulls eye 157.00

The US Dollar gains ground against the Japanese Yen (JPY) and climbs 0.38% in an upbeat market mood.
New
update2024.05.21 04:50

Gold price near all-time high amid Fed rate cut speculation

Gold price extended its gains on Monday, yet it trades slightly below the all-time high of $2,450 reached during the Asian session amid increasing expectations that major central banks, including the Federal Reserve, might ease policy during 2024.
New
update2024.05.21 03:46

USD/NOK remains steady as cautious remarks by Fed officials underpin the USD

The USD/NOK pair is trading with mild gains, with the USD holding its ground against its peers.
New
update2024.05.21 03:34

Crude Oil roils on Monday, WTI finds then loses $80

West Texas Intermediate (WTI) US Crude Oil rose briefly above $80.00 per barrel on Monday as risk appetite remains close to the surface, but topside momentum remains thin.
New
update2024.05.21 03:23

Dow Jones Industrial Average tests new all-time high but struggling with 40,000

The Dow Jones Industrial Average (DJIA) tested into a new all-time record high on Monday, but price action is getting pushed into the middle near the 40,000.00 handle.
New
update2024.05.21 02:37

Disclaimer:arw

All information and content provided on this website is provided for informational purposes only and is not intended to solicit any investment. Although all efforts are made in order to ensure that the information is correct, no guarantee is provided for the accuracy of any content on this website. Any decision made shall be the responsibility of the investor and Myforex does not take any responsibility whatsoever regarding the use of any information provided herein.

The content provided on this website belongs to Myforex and, where stated, the relevant licensors. All rights are reserved by Myforex and the relevant licensors, and no content of this website, whether in full or in part, shall be copied or displayed elsewhere without the explicit written permission of the relevant copyright holder. If you wish to use any part of the content provided on this website, please ensure that you contact Myforex.

  • Facebook
  • Twitter
  • LINE

Myforex uses cookies to improve the convenience and functionality of this website. This website may include cookies not only by us but also by third parties (advertisers, log analysts, etc.) for the purpose of tracking the activities of users. Cookie policy

I agree
share
Share
Cancel