Select Language

EUR/USD Price Analysis: Moves above 1.0700, next barrier at 21-day EMA

Breaking news

EUR/USD Price Analysis: Moves above 1.0700, next barrier at 21-day EMA

  • X
  • facebook
  • LINE
  • RSS

  • X
  • facebook
  • LINE
  • RSS
New update 2024.04.25 14:48
EUR/USD Price Analysis: Moves above 1.0700, next barrier at 21-day EMA

update 2024.04.25 14:48

  • EUR/USD could approach the 21-day EMA at 1.0727.
  • A break below 1.0700 could lead the pair toward the major support of 1.0650 and April's low at 1.0601.
  • A breach above the major level of 1.0695 suggests a weakening of bearish sentiment.

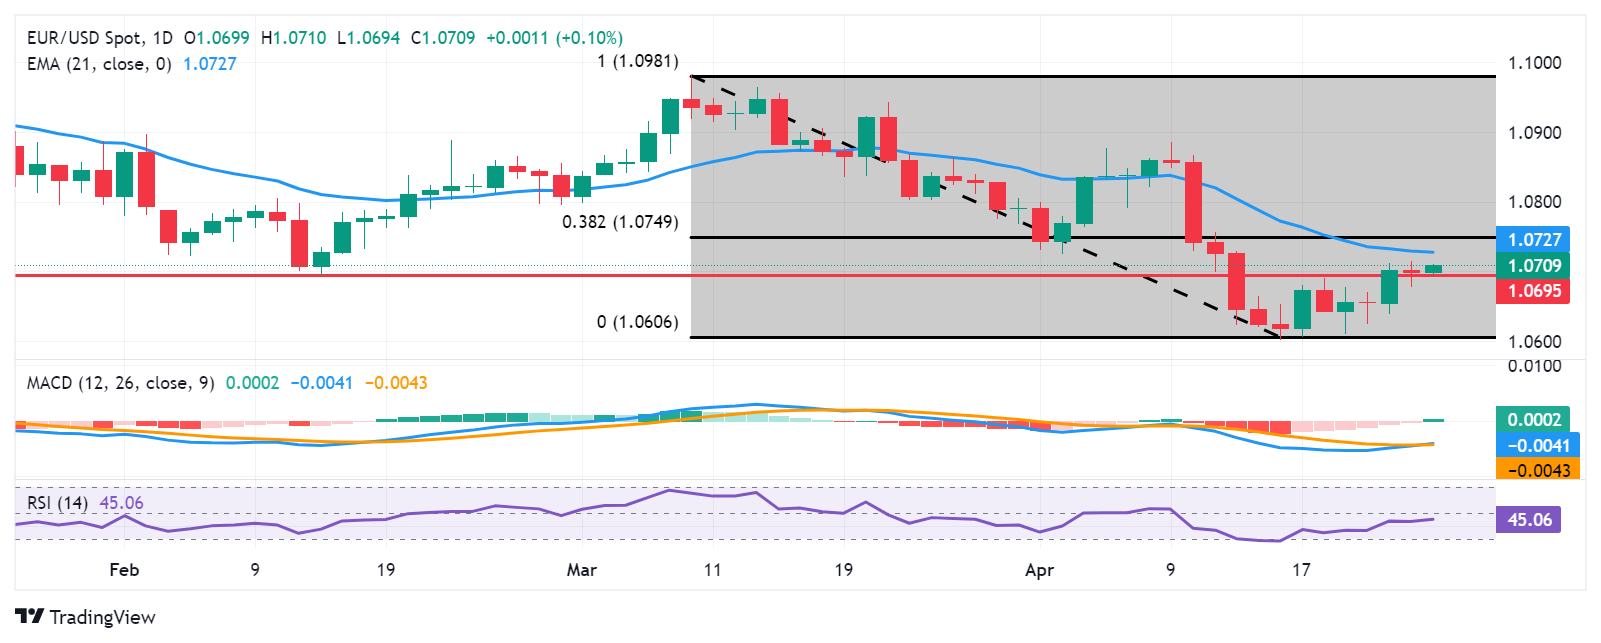
EUR/USD recovers its recent losses registered in the previous session, trading around 1.0710 during the Asian session on Thursday. From a technical standpoint, analysis suggests a weakening of bearish sentiment for the pair as it has surpassed the major level of 1.0695 and the psychological level of 1.0700.

Additionally, the lagging indicator Moving Average Convergence Divergence (MACD) indicates a shift in momentum for the EUR/USD pair, as it is positioned below the centerline but above the signal line. However, the 14-day Relative Strength Index (RSI) remains below the 50-mark, indicating a continuation of bearish momentum.

Key support for the EUR/USD pair is likely to be found around the psychological level of 1.0700. A breach below this level could apply downward pressure on the pair, potentially leading it toward the region surrounding the major support level of 1.0650. Further support may be identified around April's low at 1.0601, which aligns with the psychological level of 1.0600.

On the upside, the immediate barrier for the pair could be the 21-day Exponential Moving Average (EMA) at 1.0727. A breakthrough above this level could propel the pair towards the 38.2% Fibonacci retracement level at 1.0749, which is drawn between the levels of 1.0981 and 1.0606, coinciding with the major level of 1.0750.

EUR/USD: Daily Chart

EUR/USD

Overview
Today last price 1.0709
Today Daily Change 0.0010
Today Daily Change % 0.09
Today daily open 1.0699
 
Trends
Daily SMA20 1.0735
Daily SMA50 1.0808
Daily SMA100 1.0849
Daily SMA200 1.081
 
Levels
Previous Daily High 1.0714
Previous Daily Low 1.0678
Previous Weekly High 1.069
Previous Weekly Low 1.0601
Previous Monthly High 1.0981
Previous Monthly Low 1.0768
Daily Fibonacci 38.2% 1.0692
Daily Fibonacci 61.8% 1.07
Daily Pivot Point S1 1.068
Daily Pivot Point S2 1.0661
Daily Pivot Point S3 1.0643
Daily Pivot Point R1 1.0716
Daily Pivot Point R2 1.0733
Daily Pivot Point R3 1.0752


Date

Created

 : 2024.04.25

Update

Last updated

 : 2024.04.25

Related articles


Show more

FXStreet

Financial media

arrow
FXStreet

FXStreet is a forex information website, delivering market analysis and news articles 24/7.
It features a number of articles contributed by well-known analysts, in addition to the ones by its editorial team.
Founded in 2000 by Francesc Riverola, a Spanish economist, it has grown to become a world-renowned information website.

Was this article helpful?

We hope you find this article useful. Any comments or suggestions will be greatly appreciated.  
We are also looking for writers with extensive experience in forex and crypto to join us.

please contact us at [email protected].

Thank you for your feedback.

Most viewed

NZD/USD Price Analysis: Bullish momentum picks up, buyers rejected at the 100-day SMA

At the end of the week, the NZD/USD rallied to around 0.6050, up by 0.80%.
New
update2024.05.04 07:11

EUR/USD breaks above recent congestion as US NFP miss drives down Greenback

EUR/USD drove into a fresh weekly high on Friday, breaking above recent congestion after a broad miss in US Nonfarm Payrolls (NFP) labor and wages figures that reignited broad-market hopes for an accelerated path towards Federal Reserve (Fed) rate cuts.
New
update2024.05.04 06:47

Silver Price Analysis: XAG/USD test key resistance levels amid uptrends

Silver price uptrend continued during the week despite registering losses of around 2.40%.
New
update2024.05.04 05:41

USD/NOK dives on weak NFP figures from April

The USD/NOK pair is trading at 10.861, exhibiting a decline of 1.19% on Friday's session.
New
update2024.05.04 04:55

GBP/JPY flounders near 192.00 after suspected BoJ interventions flatten markets

GBP/JPY is trading flat near the 192.00 handle after the Bank of Japan (BoJ) is suspected of directly intervening in FX markets to prop up the battered Japanese Yen (JPY) twice in two days earlier this week.
New
update2024.05.04 04:49

USD/JPY Price Analysis: Bears charge helped by intervention rumors, eye 152.00

The USD/JPY dropped for the third straight day and accumulated losses of more than 3.40% in the week after a suspected intervention by the Bank of Japan (BoJ) on Monday.
New
update2024.05.04 04:27

EUR/JPY Price Analysis: Bearish indications dominate and sellers consolidate below the 20-day SMA

The EUR/JPY pair declined to 164.72 on Friday, reflecting subtle bears' influence with daily losses.
New
update2024.05.04 03:36

Gold price retreats from daily highs as US NFP dampens demand

Gold erased its earlier gains on Friday after the US Bureau of Labor Statistics (BLS) revealed that Nonfarm Payrolls for April missed estimates, depicting a cooling jobs market.
New
update2024.05.04 03:21

Dow Jones Industrial Average climbs over 400 points on volatile NFP Friday

The Dow Jones Industrial Average (DJIA) climbed 1.15% on Friday after a broad miss from US Nonfarm Payrolls (NFP) and other key labor data revealed a steep weakening in the US domestic economy, sparking increased bets of rate cuts from the Federal Reserve.
New
update2024.05.04 02:47

Mexican Peso struggles as US economic data fuels Fed rate cut speculation

The Mexican Peso failed to hold to earlier gains versus the US Dollar on Friday after a softer-than-expected employment report in the United States (US) reignited speculation that the Federal Reserve (Fed) might lower interest rates as the jobs market weakened.
update2024.05.04 01:55

Disclaimer:arw

All information and content provided on this website is provided for informational purposes only and is not intended to solicit any investment. Although all efforts are made in order to ensure that the information is correct, no guarantee is provided for the accuracy of any content on this website. Any decision made shall be the responsibility of the investor and Myforex does not take any responsibility whatsoever regarding the use of any information provided herein.

The content provided on this website belongs to Myforex and, where stated, the relevant licensors. All rights are reserved by Myforex and the relevant licensors, and no content of this website, whether in full or in part, shall be copied or displayed elsewhere without the explicit written permission of the relevant copyright holder. If you wish to use any part of the content provided on this website, please ensure that you contact Myforex.

  • Facebook
  • Twitter
  • LINE

Myforex uses cookies to improve the convenience and functionality of this website. This website may include cookies not only by us but also by third parties (advertisers, log analysts, etc.) for the purpose of tracking the activities of users. Cookie policy

I agree
share
Share
Cancel