Select Language

EUR/JPY Price Analysis: Bullish momentum prevails, reaches its highest since 2008

Breaking news

EUR/JPY Price Analysis: Bullish momentum prevails, reaches its highest since 2008

  • X
  • facebook
  • LINE
  • RSS

  • X
  • facebook
  • LINE
  • RSS
New update 2024.04.24 03:09
EUR/JPY Price Analysis: Bullish momentum prevails, reaches its highest since 2008

update 2024.04.24 03:09

  • The daily RSI signals growing buying momentum for the EUR/JPY.
  • The daily MACD also shows a strengthening buying momentum.
  • On the hourly chart, the same indicators reveal signs of a more immediate buyer dominance.

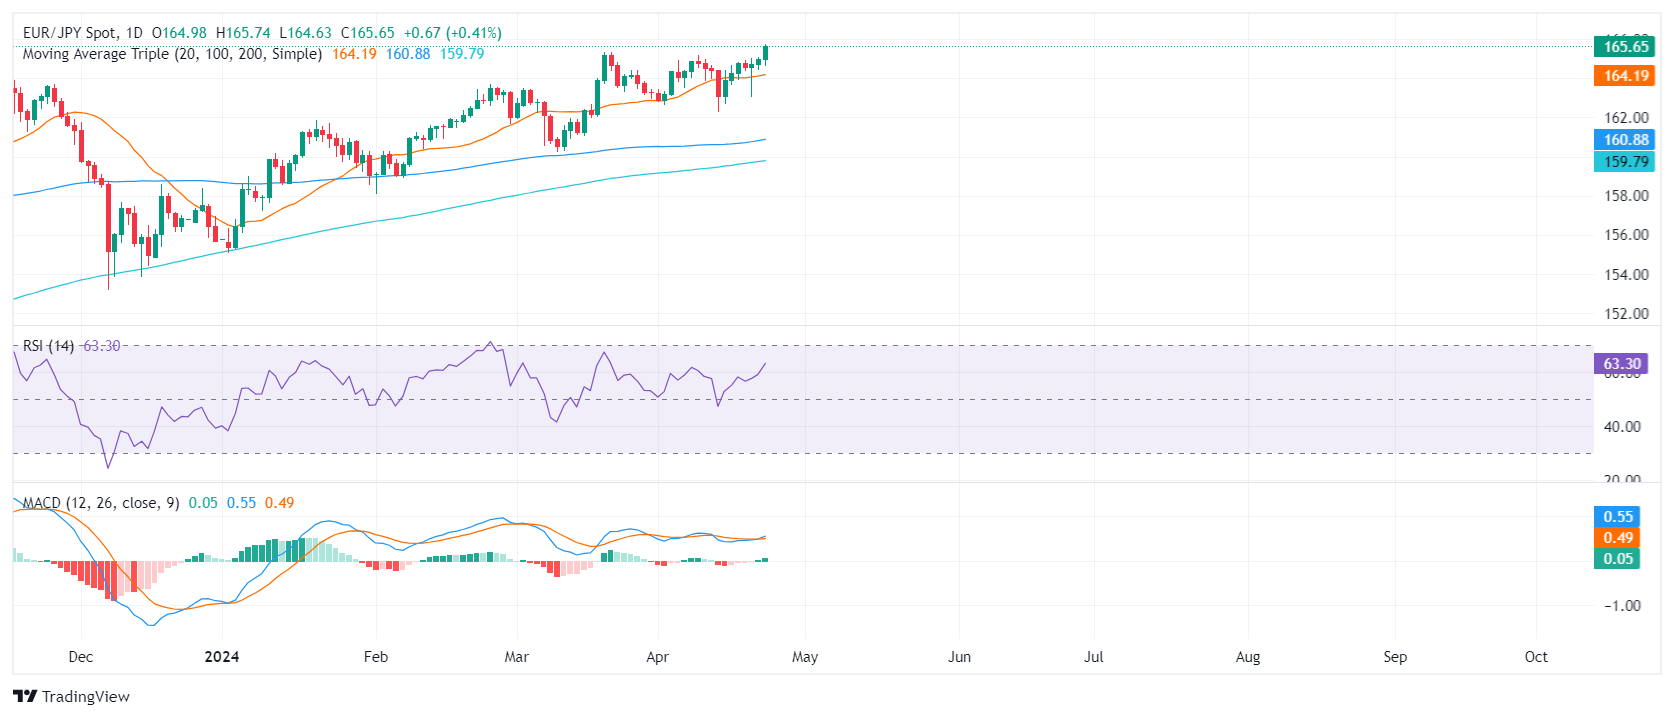
The EUR/JPY rose towards 165.64 on Tuesday's session, its highest level since 2008, showcasing clear bullish signals that point to further gains. With buyers in command, the overall landscape for the pair can be viewed as bullish.

On the daily chart, the Relative Strength Index (RSI) shows an ascending trend for the, moving deep in positive terrain. Concurrently, the Moving Average Convergence Divergence (MACD) backs this outlook as its histogram displays ascending green bars, underscoring the positive momentum.

EUR/JPY daily chart

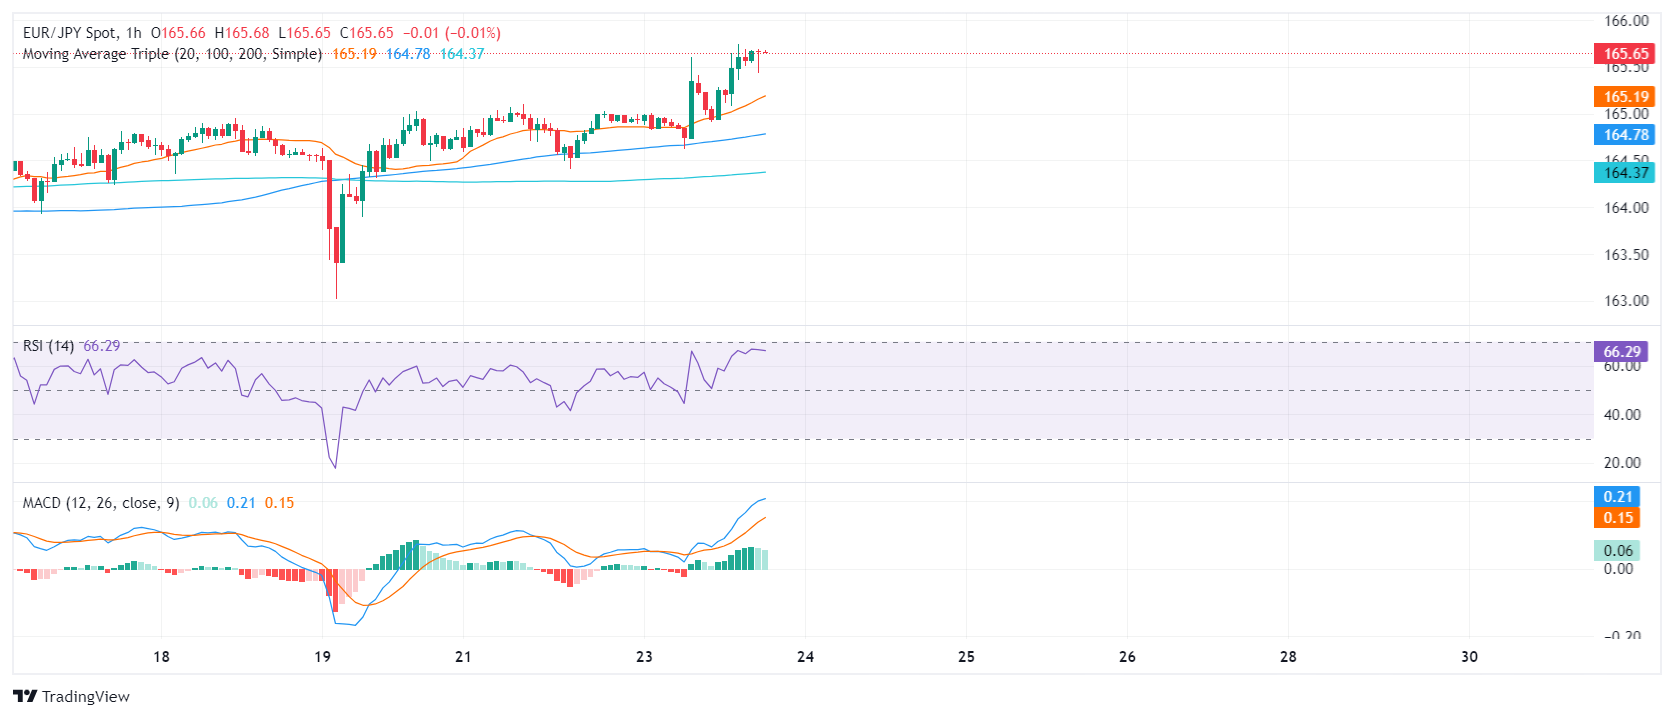
In contrast, the insight from the hourly chart provides a slightly different perspective. While the RSI also showcases an uptrend into positive territory, the current level was higher than that of the daily chart, hinting at a more immediate upward momentum. Simultaneously, the MACD on the hourly chart strengthens the bullish bias, evident from the rising green bars.

EUR/JPY hourly chart

Observing the broader view, the EUR/JPY  stands above its 20, 100, and 200-day Simple Moving Average (SMA), suggesting a strong bullish trend both in the short and long-term perspectives. Overall, bears show no signs of recovering and as bulls capture fresh multi-year highs, there are no technical signals that threaten the clear bullish trend.


EUR/JPY

Overview
Today last price 165.66
Today Daily Change 0.68
Today Daily Change % 0.41
Today daily open 164.98
 
Trends
Daily SMA20 164.12
Daily SMA50 163.17
Daily SMA100 160.81
Daily SMA200 159.74
 
Levels
Previous Daily High 165.1
Previous Daily Low 164.4
Previous Weekly High 165.03
Previous Weekly Low 162.67
Previous Monthly High 165.36
Previous Monthly Low 160.22
Daily Fibonacci 38.2% 164.84
Daily Fibonacci 61.8% 164.67
Daily Pivot Point S1 164.55
Daily Pivot Point S2 164.13
Daily Pivot Point S3 163.85
Daily Pivot Point R1 165.26
Daily Pivot Point R2 165.53
Daily Pivot Point R3 165.96


Date

Created

 : 2024.04.24

Update

Last updated

 : 2024.04.24

Related articles


Show more

FXStreet

Financial media

arrow
FXStreet

FXStreet is a forex information website, delivering market analysis and news articles 24/7.
It features a number of articles contributed by well-known analysts, in addition to the ones by its editorial team.
Founded in 2000 by Francesc Riverola, a Spanish economist, it has grown to become a world-renowned information website.

Was this article helpful?

We hope you find this article useful. Any comments or suggestions will be greatly appreciated.  
We are also looking for writers with extensive experience in forex and crypto to join us.

please contact us at [email protected].

Thank you for your feedback.

Most viewed

NZD/USD Price Analysis: Bullish momentum picks up, buyers rejected at the 100-day SMA

At the end of the week, the NZD/USD rallied to around 0.6050, up by 0.80%.
New
update2024.05.04 07:11

EUR/USD breaks above recent congestion as US NFP miss drives down Greenback

EUR/USD drove into a fresh weekly high on Friday, breaking above recent congestion after a broad miss in US Nonfarm Payrolls (NFP) labor and wages figures that reignited broad-market hopes for an accelerated path towards Federal Reserve (Fed) rate cuts.
New
update2024.05.04 06:47

Silver Price Analysis: XAG/USD test key resistance levels amid uptrends

Silver price uptrend continued during the week despite registering losses of around 2.40%.
New
update2024.05.04 05:41

USD/NOK dives on weak NFP figures from April

The USD/NOK pair is trading at 10.861, exhibiting a decline of 1.19% on Friday's session.
New
update2024.05.04 04:55

GBP/JPY flounders near 192.00 after suspected BoJ interventions flatten markets

GBP/JPY is trading flat near the 192.00 handle after the Bank of Japan (BoJ) is suspected of directly intervening in FX markets to prop up the battered Japanese Yen (JPY) twice in two days earlier this week.
New
update2024.05.04 04:49

USD/JPY Price Analysis: Bears charge helped by intervention rumors, eye 152.00

The USD/JPY dropped for the third straight day and accumulated losses of more than 3.40% in the week after a suspected intervention by the Bank of Japan (BoJ) on Monday.
New
update2024.05.04 04:27

EUR/JPY Price Analysis: Bearish indications dominate and sellers consolidate below the 20-day SMA

The EUR/JPY pair declined to 164.72 on Friday, reflecting subtle bears' influence with daily losses.
New
update2024.05.04 03:36

Gold price retreats from daily highs as US NFP dampens demand

Gold erased its earlier gains on Friday after the US Bureau of Labor Statistics (BLS) revealed that Nonfarm Payrolls for April missed estimates, depicting a cooling jobs market.
New
update2024.05.04 03:21

Dow Jones Industrial Average climbs over 400 points on volatile NFP Friday

The Dow Jones Industrial Average (DJIA) climbed 1.15% on Friday after a broad miss from US Nonfarm Payrolls (NFP) and other key labor data revealed a steep weakening in the US domestic economy, sparking increased bets of rate cuts from the Federal Reserve.
New
update2024.05.04 02:47

Mexican Peso struggles as US economic data fuels Fed rate cut speculation

The Mexican Peso failed to hold to earlier gains versus the US Dollar on Friday after a softer-than-expected employment report in the United States (US) reignited speculation that the Federal Reserve (Fed) might lower interest rates as the jobs market weakened.
New
update2024.05.04 01:55

Disclaimer:arw

All information and content provided on this website is provided for informational purposes only and is not intended to solicit any investment. Although all efforts are made in order to ensure that the information is correct, no guarantee is provided for the accuracy of any content on this website. Any decision made shall be the responsibility of the investor and Myforex does not take any responsibility whatsoever regarding the use of any information provided herein.

The content provided on this website belongs to Myforex and, where stated, the relevant licensors. All rights are reserved by Myforex and the relevant licensors, and no content of this website, whether in full or in part, shall be copied or displayed elsewhere without the explicit written permission of the relevant copyright holder. If you wish to use any part of the content provided on this website, please ensure that you contact Myforex.

  • Facebook
  • Twitter
  • LINE

Myforex uses cookies to improve the convenience and functionality of this website. This website may include cookies not only by us but also by third parties (advertisers, log analysts, etc.) for the purpose of tracking the activities of users. Cookie policy

I agree
share
Share
Cancel