Select Language

NZD/USD Price Analysis: Bears hold sway, subtle signs of potential bullish reversal emerging

Breaking news

NZD/USD Price Analysis: Bears hold sway, subtle signs of potential bullish reversal emerging

  • X
  • facebook
  • LINE
  • RSS

  • X
  • facebook
  • LINE
  • RSS
New update 2024.04.23 06:33
NZD/USD Price Analysis: Bears hold sway, subtle signs of potential bullish reversal emerging

update 2024.04.23 06:33

  • Diminishing red bars of the daily MACD imply a potential easing of bearish momentum, signaling an early indication of a bullish turnaround.
  • The hourly chart reveals an RSI oscillating in the positive zone, and MACD with green bars, signaling potential short-term positive momentum.

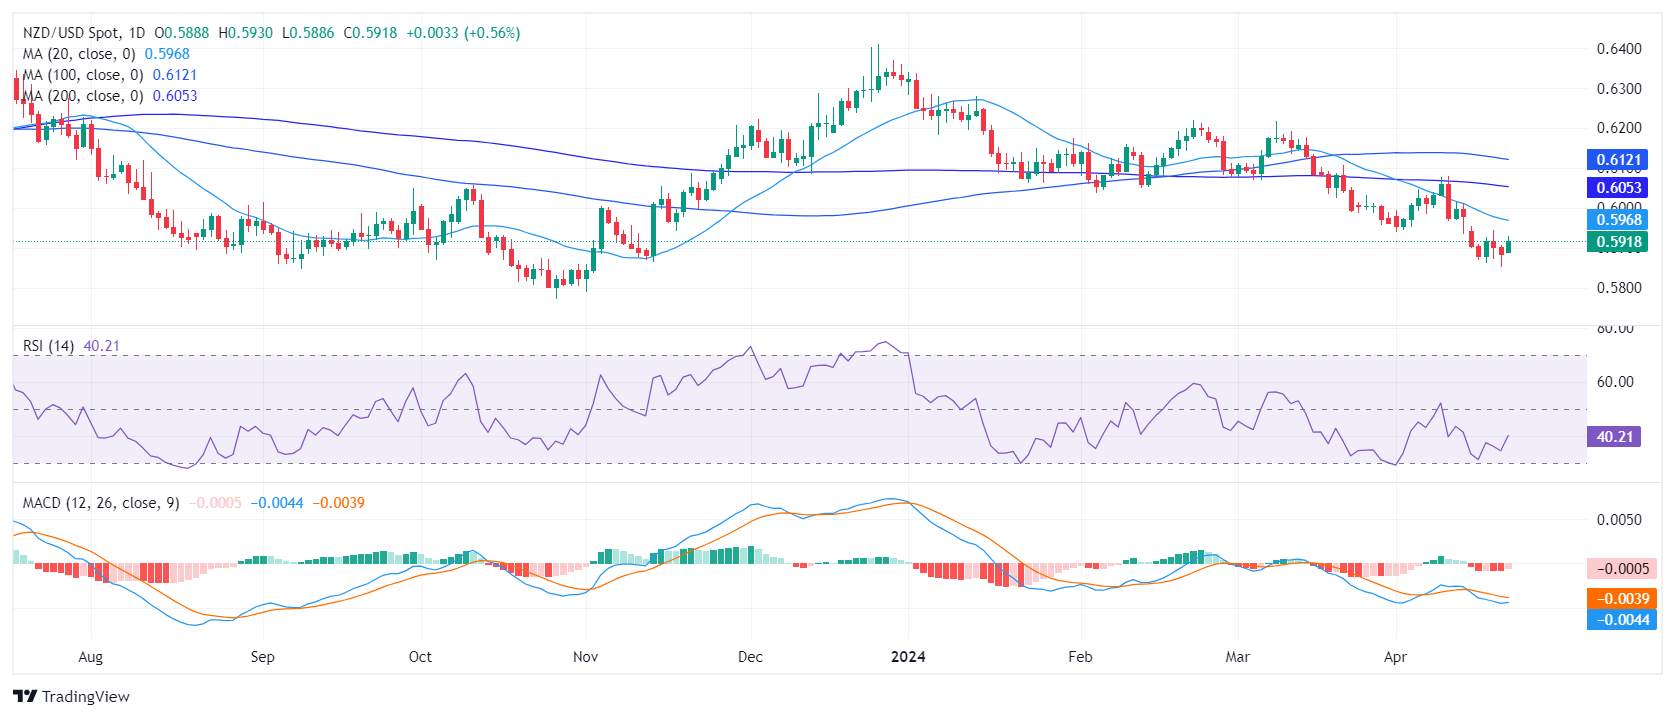
The NZD/USD pair advanced to 0.5920 on Monday, reflecting a gain of 0.47%. Overall, the bearish force remains strong, while the bulls begin to give signs of potential recovery, highlighting the start of a possible bullish reversal.

On the daily chart, the Relative Strength Index (RSI) remains in negative territory, indicating an ongoing bearish momentum. Although there is a minor upward trend, it remains short of breaking into the positive zone. The decreasing red bars of the Moving Average Convergence Divergence (MACD) suggest a slide in negative momentum, indicating possible signs of a potential bullish reversal.

NZD/USD daily chart

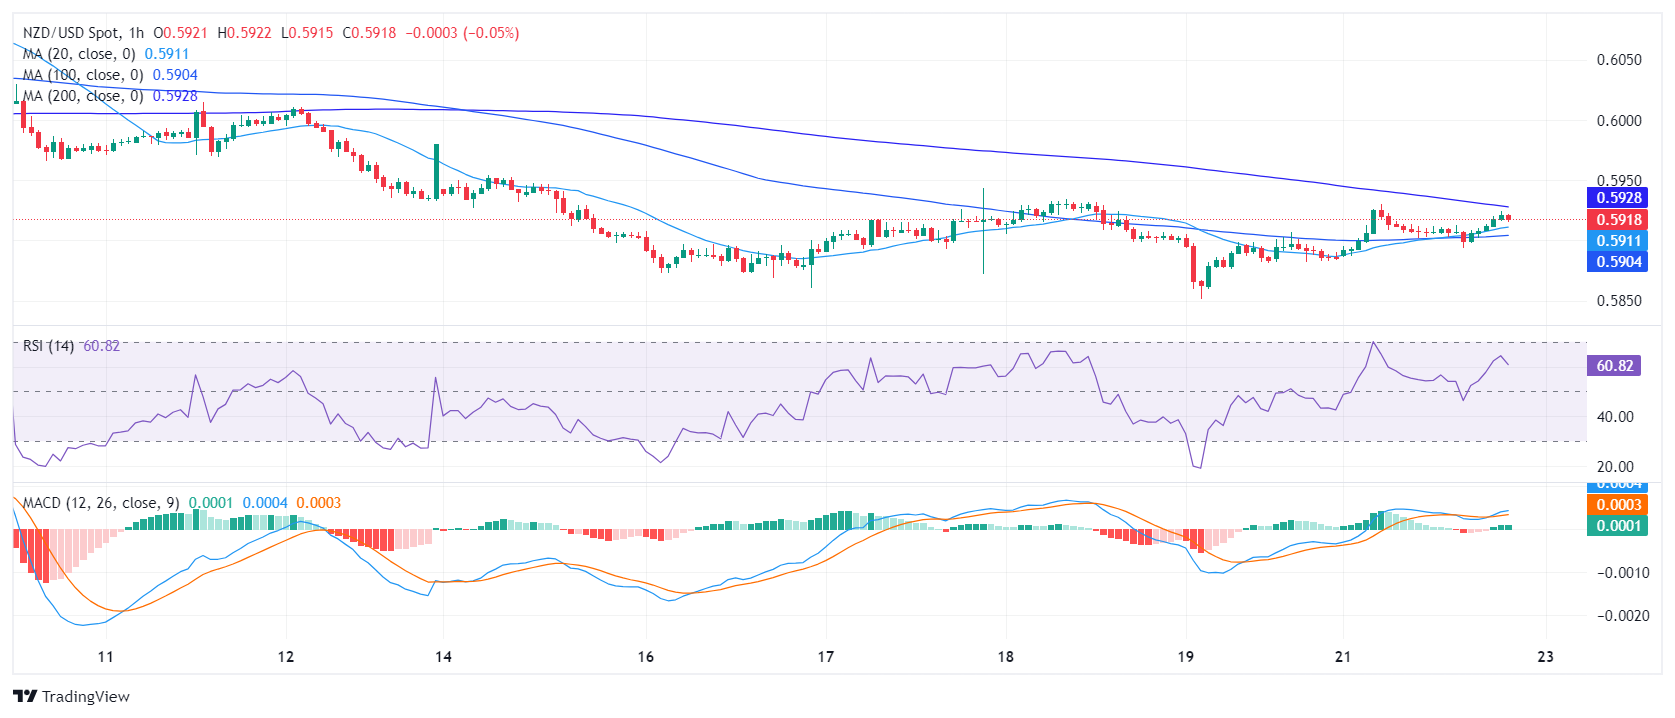
On the hourly chart, a similar condition prevails. The RSI has been oscillating in the positive territory for most of the session, but recently recorded a slight downward inclination, signaling a potential pullback. The MACD histogram also shows rising green bars, indicating a surge in positive momentum.

NZD/USD hourly chart

The broader market perspective reveals much regarding the NZD/USD's performance versus its Simple Moving Average (SMA). With the pair being below the 20,100 and 200-day SMA, a long and short-term downward pressure on the currency is evident.

In summary, there is a bearish dominance in the market, reinforced by both the RSI and MACD trends on the daily and hourly charts, as well as the SMA positioning. However, the slight increase in the daily RSI and the diminishing bearish momentum in the MACD could signify the early stages of a market reversal.


NZD/USD

Overview
Today last price 0.5919
Today Daily Change 0.0034
Today Daily Change % 0.58
Today daily open 0.5885
 
Trends
Daily SMA20 0.5973
Daily SMA50 0.6062
Daily SMA100 0.6123
Daily SMA200 0.6055
 
Levels
Previous Daily High 0.5907
Previous Daily Low 0.5851
Previous Weekly High 0.5954
Previous Weekly Low 0.5851
Previous Monthly High 0.6218
Previous Monthly Low 0.5956
Daily Fibonacci 38.2% 0.5873
Daily Fibonacci 61.8% 0.5886
Daily Pivot Point S1 0.5855
Daily Pivot Point S2 0.5825
Daily Pivot Point S3 0.5799
Daily Pivot Point R1 0.5911
Daily Pivot Point R2 0.5937
Daily Pivot Point R3 0.5967


Date

Created

 : 2024.04.23

Update

Last updated

 : 2024.04.23

Related articles


Show more

FXStreet

Financial media

arrow
FXStreet

FXStreet is a forex information website, delivering market analysis and news articles 24/7.
It features a number of articles contributed by well-known analysts, in addition to the ones by its editorial team.
Founded in 2000 by Francesc Riverola, a Spanish economist, it has grown to become a world-renowned information website.

Was this article helpful?

We hope you find this article useful. Any comments or suggestions will be greatly appreciated.  
We are also looking for writers with extensive experience in forex and crypto to join us.

please contact us at [email protected].

Thank you for your feedback.

Most viewed

NZD/USD Price Analysis: Bulls assert dominance, closes its best week of 2024

In Friday's session, the NZD/USD rose to the 0.6137 level, demonstrating a strong bullish trend.
New
update2024.05.18 07:06

USD/JPY Price Analysis: Extends gains but remains below 156.00

The USD/JPY extended its gains late on Friday's North American session, though it's set to finish the week unchanged.
New
update2024.05.18 05:44

WTI pushes into fresh weekly high late Friday as Crude oil recovers ground

West Texas Intermediate (WTI) rose in late-day bidding on Friday as Crude Oil markets recover, but still remains within recent consolidation levels.
New
update2024.05.18 05:31

USD/THB plunges and approaches the 100-day SMA, USD cushioned by Fed officials

The USD/THB continued to lose ground on Friday despite the cautious tone seen in the latest Federal Reserve (Fed) officials' words.
New
update2024.05.18 04:52

Gold price surges above $2,400, eyeing all-time highs

Gold's price skyrocketed during the North American session ahead of the weekend as XAU/USD traded above $2,400, posting gains of more than 1.5% amid higher US Treasury bond yields.
New
update2024.05.18 04:27

Dow Jones Industrial Average adrift on quiet Friday volumes

The Dow Jones Industrial Average (DJIA) is on the high side as markets wind down a hectic trading week that saw rate cut hopes return to the forefront after US Consumer Price Index (CPI) inflation eased to a three-month low.
New
update2024.05.18 03:12

USD/NOK with light losses on quiet Friday, cautious Fed supports the USD

The USD/NOK stands mildly down on Friday with the Greenback holding its ground thanks to the cautious tone of the Federal Reserve (Fed) officials.
New
update2024.05.18 03:05

Canadian Dollar sticks to the middle on tepid Friday

The Canadian Dollar (CAD) is trading softly on a low-volatility Friday, sticking close to the midrange.
New
update2024.05.18 02:33

Mexican Peso hits four-week high on hawkish Banxico remarks

The Mexican Peso continues to record gains versus the US Dollar, refreshing its four-week high as the rally continued.
New
update2024.05.18 02:25

US Dollar stands neutral as Fed officials remain cautious

The US Dollar Index (DXY) is currently trading at 104.50, maintaining a neutral stance.
New
update2024.05.18 01:47

Disclaimer:arw

All information and content provided on this website is provided for informational purposes only and is not intended to solicit any investment. Although all efforts are made in order to ensure that the information is correct, no guarantee is provided for the accuracy of any content on this website. Any decision made shall be the responsibility of the investor and Myforex does not take any responsibility whatsoever regarding the use of any information provided herein.

The content provided on this website belongs to Myforex and, where stated, the relevant licensors. All rights are reserved by Myforex and the relevant licensors, and no content of this website, whether in full or in part, shall be copied or displayed elsewhere without the explicit written permission of the relevant copyright holder. If you wish to use any part of the content provided on this website, please ensure that you contact Myforex.

  • Facebook
  • Twitter
  • LINE

Myforex uses cookies to improve the convenience and functionality of this website. This website may include cookies not only by us but also by third parties (advertisers, log analysts, etc.) for the purpose of tracking the activities of users. Cookie policy

I agree
share
Share
Cancel