Select Language

NZD/JPY Price Analysis: Bullish momentum gains as bears failed to conquer the 20-day SMA

Breaking news

NZD/JPY Price Analysis: Bullish momentum gains as bears failed to conquer the 20-day SMA

  • X
  • facebook
  • LINE
  • RSS

  • X
  • facebook
  • LINE
  • RSS
New update 2024.04.23 04:54
NZD/JPY Price Analysis: Bullish momentum gains as bears failed to conquer the 20-day SMA

update 2024.04.23 04:54

  • The NZD/JPY's daily RSI reveals a transition towards positive territory, indicating a growing buying momentum.
  • Both daily and hourly MACD portray a neutral scenario with their flat green bars, neither favoring buyers nor sellers significantly.
  • Buyer's decisive support at the 20-day SMA in recent sessions indicates heightened bullish sentiment within the market.

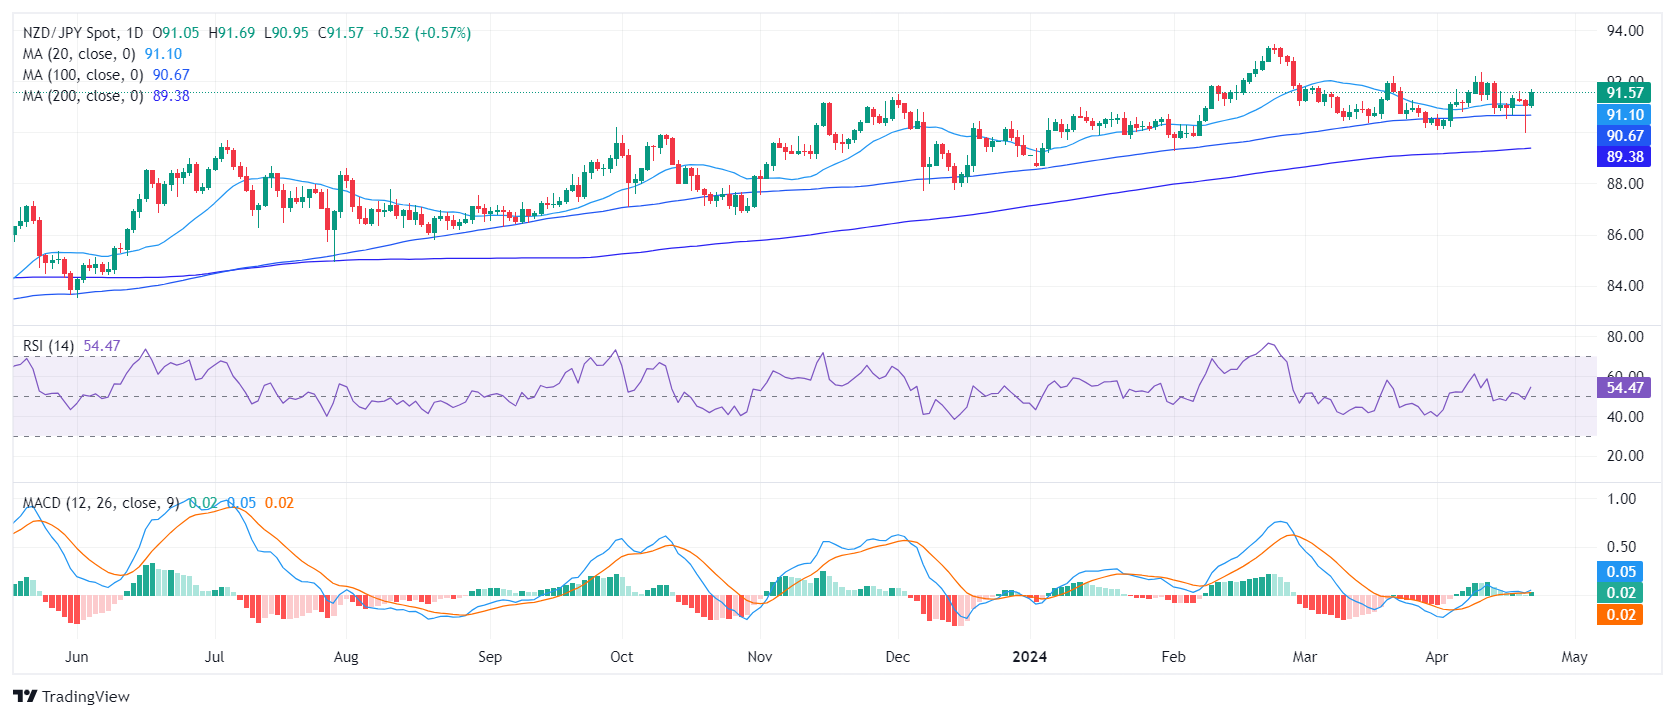
The NZD/JPY rose to 91.59 on Monday and maintains a steady uptrend. Indicators on the daily and hourly charts are favoring the buyers and as the bears failed to breach the 20-day Simple Moving Average (SMA), the outlook remains positive for the short term.

On the daily chart, the Relative Strength Index (RSI) reveals a transition from negative to positive territory, currently at 55. This shift shows a slight bullish momentum, indicating that traders are favoring more buying activities. The Moving Average Convergence Divergence (MACD) histogram exhibits flat green bars, suggesting a neutral momentum, neither favoring buyers nor sellers significantly.

NZD/JPY daily chart

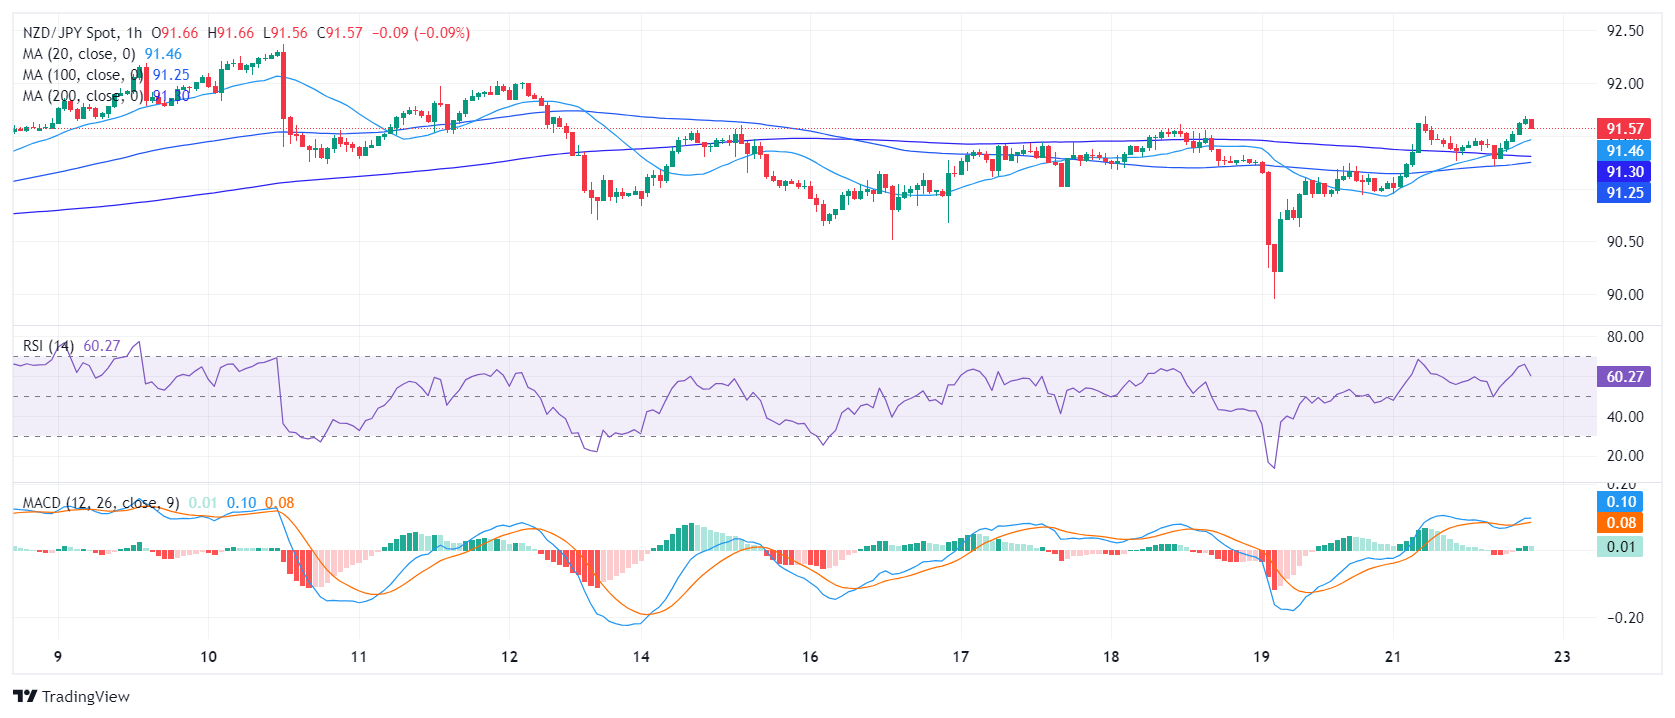
On the hourly chart, the RSI advances further into positive territory, peaking at 64 before slightly receding to 59. This movement signifies that buying activities have intensified during the American session. The MACD continues to exhibit flat green bars, mirroring the neutral momentum indicated on the daily chart.

NZD/JPY hourly chart

From a broader perspective, the NZD/JPY demonstrates a robust performance by situating above its key Simple Moving Averages (SMA), a technical indicator that averages the currency pair's closing prices over specific periods. Its stance above the 20, 100, and 200-day SMA suggests a consistent uptrend, representing both short-term and long-term strength. In the last sessions, the buyers defended the 20-day SMA at 91.10. This type of decisive support provides further evidence of a bullish sentiment among traders, which could stimulate more upside potential for the NZD/JPY.


NZD/JPY

Overview
Today last price 91.58
Today Daily Change 0.53
Today Daily Change % 0.58
Today daily open 91.05
 
Trends
Daily SMA20 91.07
Daily SMA50 91.42
Daily SMA100 90.67
Daily SMA200 89.36
 
Levels
Previous Daily High 91.32
Previous Daily Low 89.96
Previous Weekly High 91.62
Previous Weekly Low 89.96
Previous Monthly High 92.2
Previous Monthly Low 90.17
Daily Fibonacci 38.2% 90.48
Daily Fibonacci 61.8% 90.8
Daily Pivot Point S1 90.23
Daily Pivot Point S2 89.42
Daily Pivot Point S3 88.88
Daily Pivot Point R1 91.59
Daily Pivot Point R2 92.13
Daily Pivot Point R3 92.95


Date

Created

 : 2024.04.23

Update

Last updated

 : 2024.04.23

Related articles


Show more

FXStreet

Financial media

arrow
FXStreet

FXStreet is a forex information website, delivering market analysis and news articles 24/7.
It features a number of articles contributed by well-known analysts, in addition to the ones by its editorial team.
Founded in 2000 by Francesc Riverola, a Spanish economist, it has grown to become a world-renowned information website.

Was this article helpful?

We hope you find this article useful. Any comments or suggestions will be greatly appreciated.  
We are also looking for writers with extensive experience in forex and crypto to join us.

please contact us at [email protected].

Thank you for your feedback.

Most viewed

NZD/USD Price Analysis: Bulls assert dominance, closes its best week of 2024

In Friday's session, the NZD/USD rose to the 0.6137 level, demonstrating a strong bullish trend.
New
update2024.05.18 07:06

USD/JPY Price Analysis: Extends gains but remains below 156.00

The USD/JPY extended its gains late on Friday's North American session, though it's set to finish the week unchanged.
New
update2024.05.18 05:44

WTI pushes into fresh weekly high late Friday as Crude oil recovers ground

West Texas Intermediate (WTI) rose in late-day bidding on Friday as Crude Oil markets recover, but still remains within recent consolidation levels.
New
update2024.05.18 05:31

USD/THB plunges and approaches the 100-day SMA, USD cushioned by Fed officials

The USD/THB continued to lose ground on Friday despite the cautious tone seen in the latest Federal Reserve (Fed) officials' words.
New
update2024.05.18 04:52

Gold price surges above $2,400, eyeing all-time highs

Gold's price skyrocketed during the North American session ahead of the weekend as XAU/USD traded above $2,400, posting gains of more than 1.5% amid higher US Treasury bond yields.
New
update2024.05.18 04:27

Dow Jones Industrial Average adrift on quiet Friday volumes

The Dow Jones Industrial Average (DJIA) is on the high side as markets wind down a hectic trading week that saw rate cut hopes return to the forefront after US Consumer Price Index (CPI) inflation eased to a three-month low.
New
update2024.05.18 03:12

USD/NOK with light losses on quiet Friday, cautious Fed supports the USD

The USD/NOK stands mildly down on Friday with the Greenback holding its ground thanks to the cautious tone of the Federal Reserve (Fed) officials.
New
update2024.05.18 03:05

Canadian Dollar sticks to the middle on tepid Friday

The Canadian Dollar (CAD) is trading softly on a low-volatility Friday, sticking close to the midrange.
New
update2024.05.18 02:33

Mexican Peso hits four-week high on hawkish Banxico remarks

The Mexican Peso continues to record gains versus the US Dollar, refreshing its four-week high as the rally continued.
New
update2024.05.18 02:25

US Dollar stands neutral as Fed officials remain cautious

The US Dollar Index (DXY) is currently trading at 104.50, maintaining a neutral stance.
New
update2024.05.18 01:47

Disclaimer:arw

All information and content provided on this website is provided for informational purposes only and is not intended to solicit any investment. Although all efforts are made in order to ensure that the information is correct, no guarantee is provided for the accuracy of any content on this website. Any decision made shall be the responsibility of the investor and Myforex does not take any responsibility whatsoever regarding the use of any information provided herein.

The content provided on this website belongs to Myforex and, where stated, the relevant licensors. All rights are reserved by Myforex and the relevant licensors, and no content of this website, whether in full or in part, shall be copied or displayed elsewhere without the explicit written permission of the relevant copyright holder. If you wish to use any part of the content provided on this website, please ensure that you contact Myforex.

  • Facebook
  • Twitter
  • LINE

Myforex uses cookies to improve the convenience and functionality of this website. This website may include cookies not only by us but also by third parties (advertisers, log analysts, etc.) for the purpose of tracking the activities of users. Cookie policy

I agree
share
Share
Cancel