Created
: 2024.04.19


![]() 2024.04.19 21:48
2024.04.19 21:48
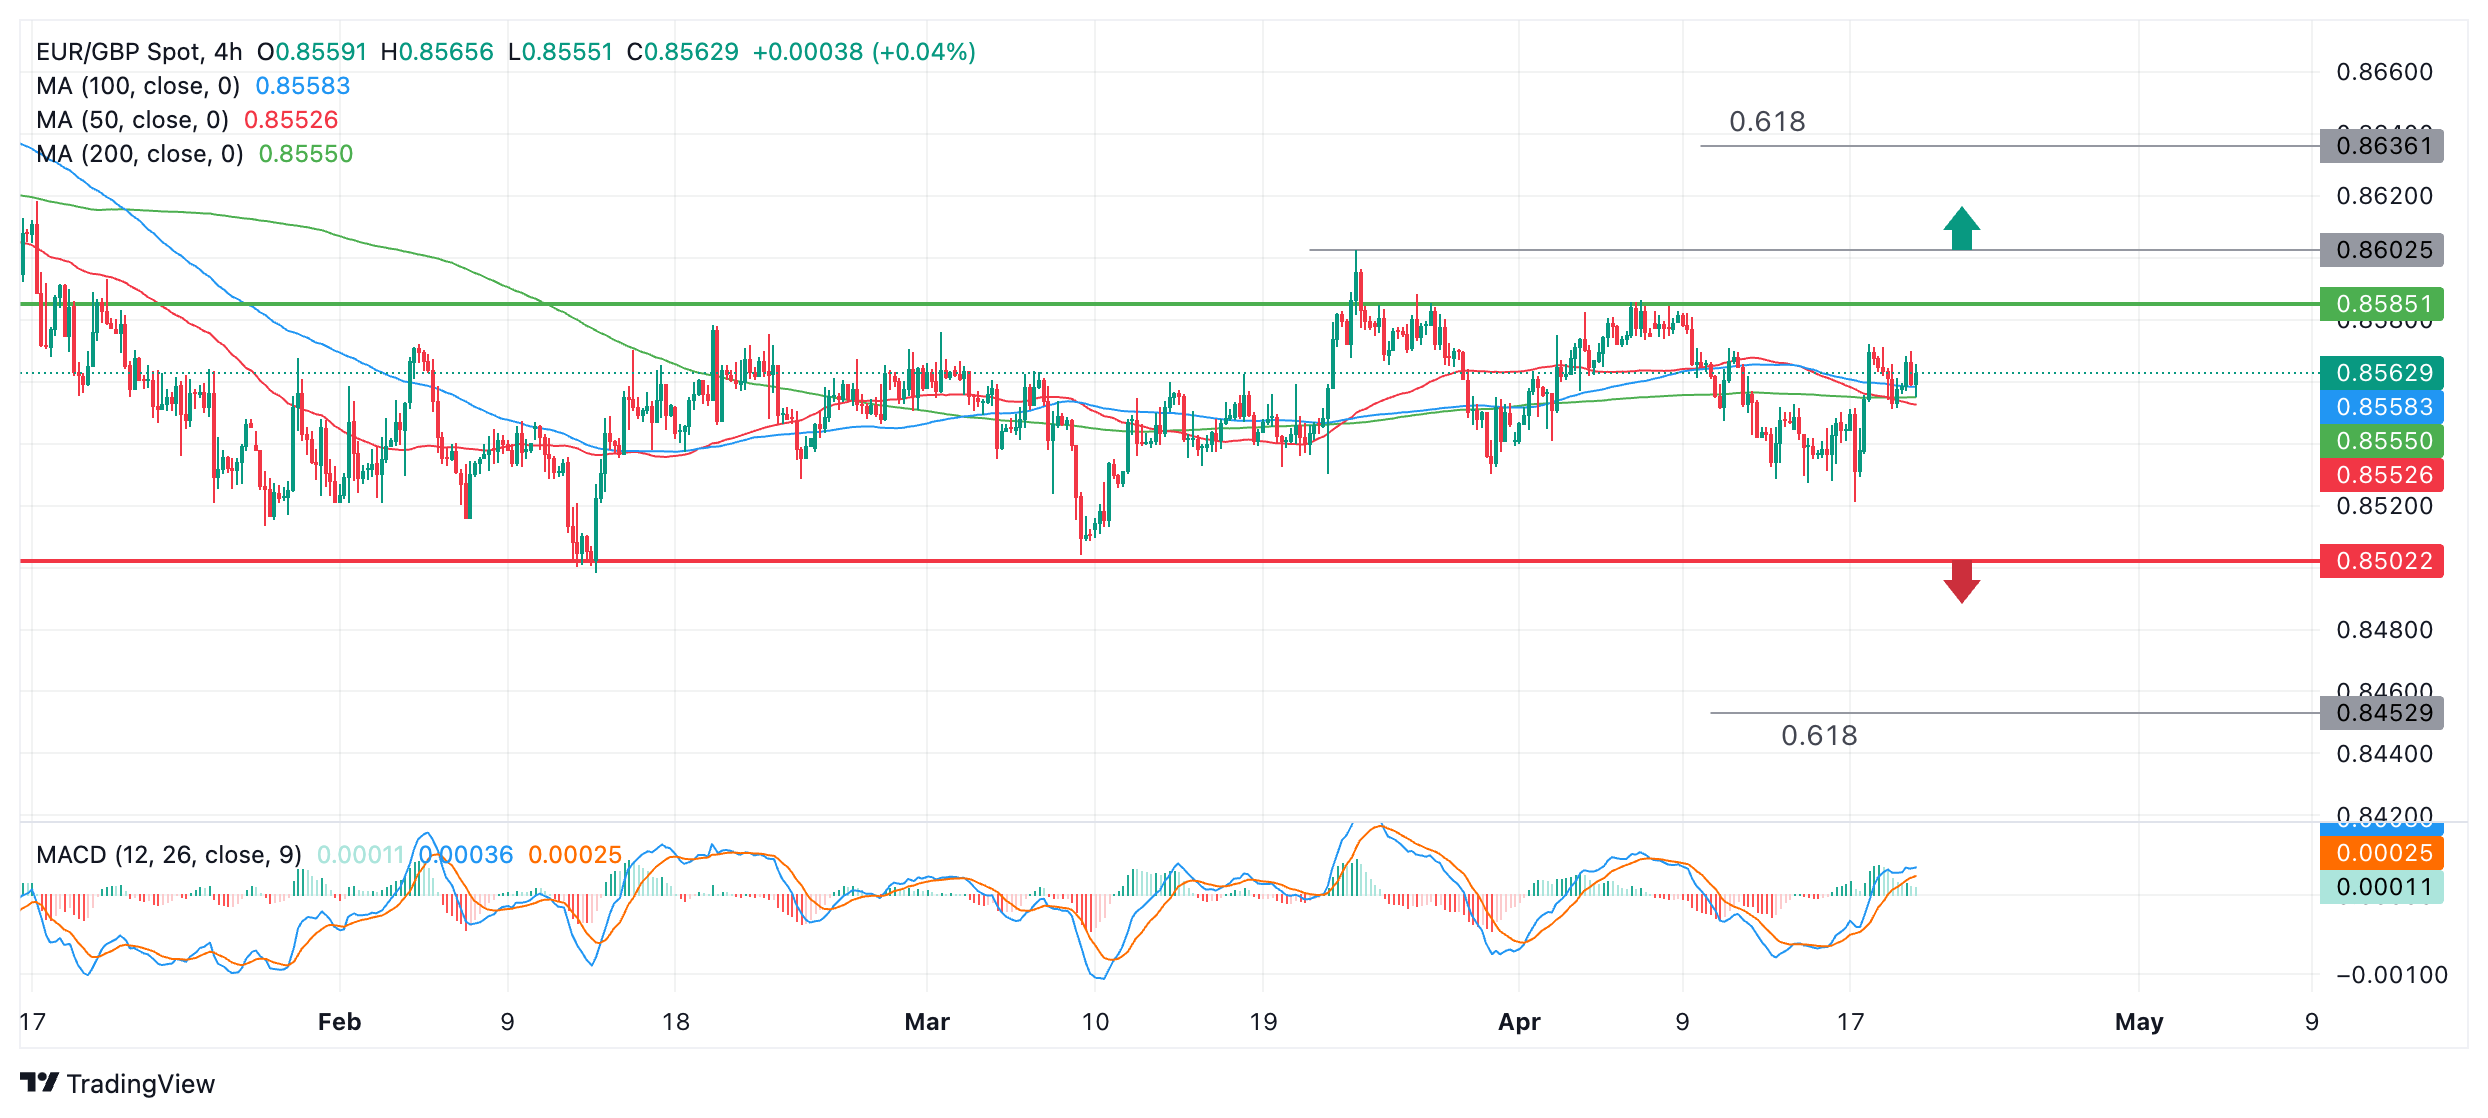
EUR/GBP price is in a sideways trend which has unfolded over three months. In technical analysis the received wisdom is that the existing trend is expected to continue until the weight of evidence points to a reversal. Since there is no evidence EUR/GBP has changed trend the conclusion must be that it will continue trading sideways.
However, it is a useful exercise to estimate at what levels the sideways trend will have been assessed as ending and a new bullish or bearish trend said to have begun.
One method to achieve this is to establish the levels of the ceiling and floor of the range. If price breaks above or below these levels it will probably indicate the trend has changed. An upside breakout will probably indicate a new bull trend is starting and vice versa for a downside breakout.
Although the range formed by EUR/GBP's does not appear to have exact high and low boundaries, it is possible to make a rough estimate of where the ceiling and the floor lie.
The floor is easier to estimate since there have been two swing lows that have bottomed at the same level, 0.8502. This is illustrated by the horizontal red line on the chart above.
The range ceiling is less clearly defined. The very highest peak in the sideways market was achieved on March 22 at 0.8602 (circled).
Another level that could be a ceiling is at 0.8585 where price has topped on two separate occasions (green horizontal line) and even 0.8571 where price has touched multiple times (green dotted line).
Which of the three should be chosen is a matter of choice. It is a tenet of technical analysis, however, that a level gains importance the more times it is tested, and so the hypothetical ceiling should at least have been touched more than once.
This rules out the March 22 high, which was only reached once. The next level at 0.8585 offers a good compromise as it has been touched twice and lies between the 0.8602 peak of the range and the 0.8571 multiple-touch level. It is this midpoint level which has been chosen for this analysis.
When price breaks out of a range it usually travels a distance that can be roughly worked out based on the height of the range. The conservative target for how far a breakout will travel is to take the 0.681 Fibonacci ratio of the height of the range and extrapolate it from the boundary higher or lower.
Based on this forecasting method, a breakout above the ceiling of the range at 0.8585 would be expected to travel to a target at 0.8636. A breakout from the bottom of the range, meanwhile, would be forecast to travel to a target at 0.8453.
These moves would constitute considerable deviations from the central tendency of the range and probably, therefore, also indicate a change in the short-term trend - from sideways to bullish for a break higher, and sideways to bearish for a break lower. As such they provide key evidence for assessing whether the trend may have changed.
A break above the March 22 peak would provide added confirmation of an upside break as there is always a risk price could retest the level and then fall back down into the range.
To avoid false breakout signals, only decisive breaks above or below the range high or low should be counted as indicating a valid breakout. A decisive break would be one characterized by a longer-than-average daily candlestick that pierces the floor or ceiling and closes near its low or high respectively, or three candlesticks in a row that pierce above or below the level.
![]()
Created
: 2024.04.19
![]()
Last updated
: 2024.04.19

FXStreet is a forex information website, delivering market analysis and news articles 24/7.
It features a number of articles contributed by well-known analysts, in addition to the ones by its editorial team.
Founded in 2000 by Francesc Riverola, a Spanish economist, it has grown to become a world-renowned information website.
We hope you find this article useful. Any comments or suggestions will be greatly appreciated.
We are also looking for writers with extensive experience in forex and crypto to join us.
please contact us at [email protected].
Disclaimer:![]()
All information and content provided on this website is provided for informational purposes only and is not intended to solicit any investment. Although all efforts are made in order to ensure that the information is correct, no guarantee is provided for the accuracy of any content on this website. Any decision made shall be the responsibility of the investor and Myforex does not take any responsibility whatsoever regarding the use of any information provided herein.
The content provided on this website belongs to Myforex and, where stated, the relevant licensors. All rights are reserved by Myforex and the relevant licensors, and no content of this website, whether in full or in part, shall be copied or displayed elsewhere without the explicit written permission of the relevant copyright holder. If you wish to use any part of the content provided on this website, please ensure that you contact Myforex.
Myforex uses cookies to improve the convenience and functionality of this website. This website may include cookies not only by us but also by third parties (advertisers, log analysts, etc.) for the purpose of tracking the activities of users. Cookie policy
