Select Language

GBP/JPY Price Analysis: Stalls within a tight range around 192.00

Breaking news

GBP/JPY Price Analysis: Stalls within a tight range around 192.00

  • X
  • facebook
  • LINE
  • RSS

  • X
  • facebook
  • LINE
  • RSS
New update 2024.04.18 08:14
GBP/JPY Price Analysis: Stalls within a tight range around 192.00

update 2024.04.18 08:14

  • GBP/JPY remains confined between 191.60 and 192.80, unable to break through key resistance at 193.00.
  • Technical analysis highlights potential decline towards strong support at 190.00, with key indicators aligning.
  • Immediate technical supports to watch include the Tenkan-Sen at 191.46 and the Kijun-Sen at 191.06.

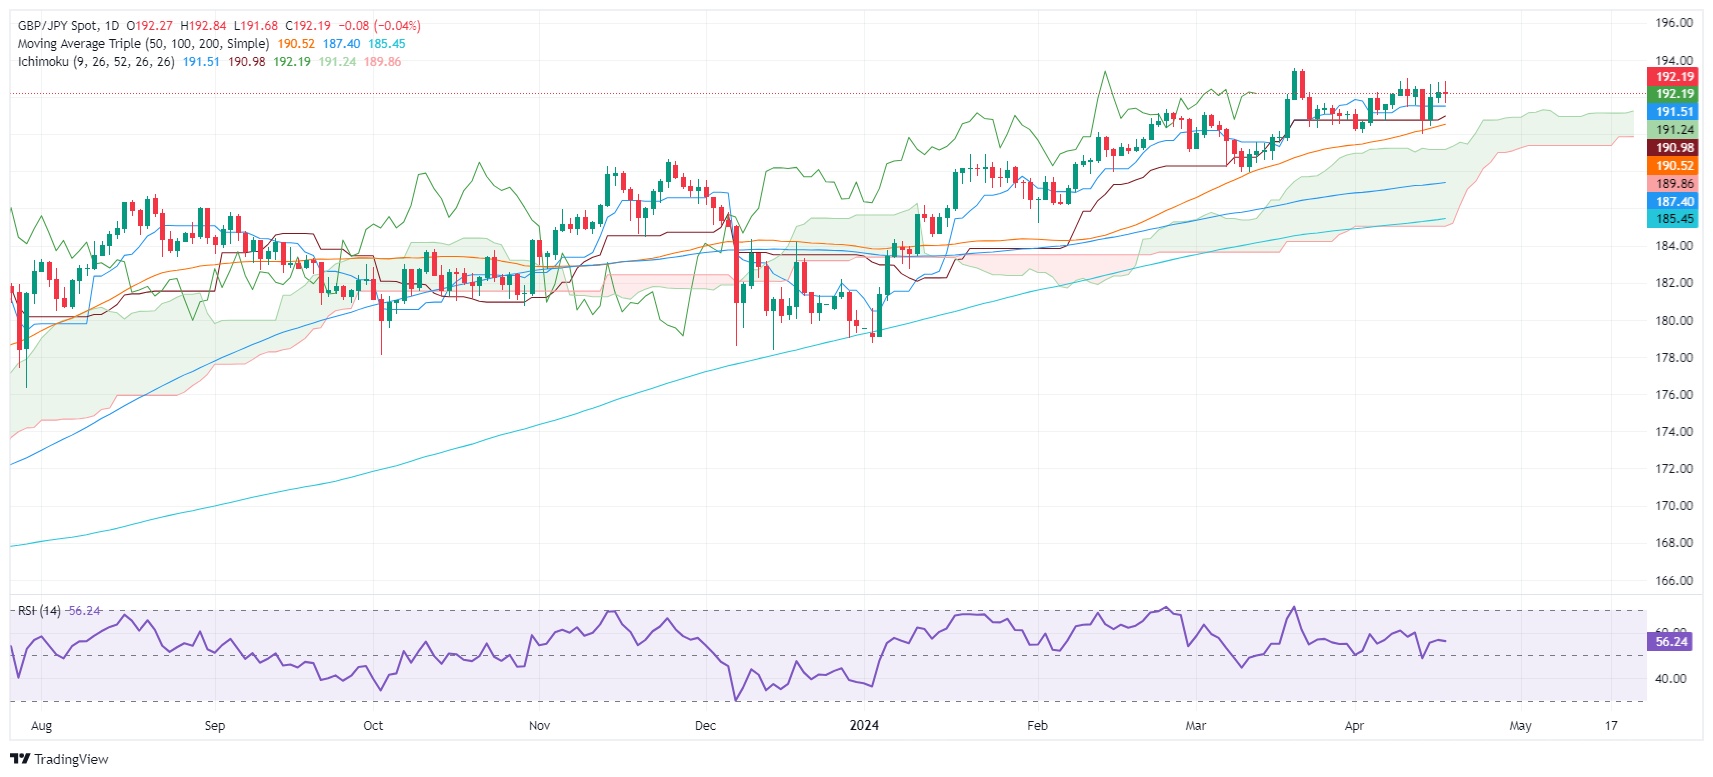
The GBP/JPY consolidates at around current exchange rates, unable to break above/below the 191.60/192.80 range, following an inflation report in the UK that sparked a rally in the GBP/USD pair. Therefore, after finishing Wednesday's session around familiar levels, the cross-currency pair trades at 192.22, virtually unchanged.

GBP/JPY Price Analysis: Technical outlook

The daily chart shows the pair has peaked, as buyers remained unable to crack the 193.00 figure to challenge the year-to-date (YTD) high of 193.53. That opened the door for a dip toward the 190.00 mark, a strong support level, as key technical indicators converged around that area. The April 2 low of 190.03, the 50-day moving average (DMA), and the top of the Ichimoku Cloud (Kumo).

Since then, the GBP/JPY remains subdued. The first resistance would be 193.00, followed by the YTD high. On the flip side, the first support would be 190.00, followed by key support levels. Up next would be the Tenkan-Sen at 191.46, the Senkou Span A at 191.26, and the Kijun-Sen at 191.06.

GBP/JPY Price Action - Daily Chart

GBP/JPY

Overview
Today last price 192.17
Today Daily Change -0.09
Today Daily Change % -0.05
Today daily open 192.26
 
Trends
Daily SMA20 191.61
Daily SMA50 190.42
Daily SMA100 187.34
Daily SMA200 185.39
 
Levels
Previous Daily High 192.82
Previous Daily Low 191.65
Previous Weekly High 193.02
Previous Weekly Low 190
Previous Monthly High 193.54
Previous Monthly Low 187.96
Daily Fibonacci 38.2% 192.37
Daily Fibonacci 61.8% 192.1
Daily Pivot Point S1 191.67
Daily Pivot Point S2 191.08
Daily Pivot Point S3 190.51
Daily Pivot Point R1 192.84
Daily Pivot Point R2 193.41
Daily Pivot Point R3 194


Date

Created

 : 2024.04.18

Update

Last updated

 : 2024.04.18

Related articles


Show more

FXStreet

Financial media

arrow
FXStreet

FXStreet is a forex information website, delivering market analysis and news articles 24/7.
It features a number of articles contributed by well-known analysts, in addition to the ones by its editorial team.
Founded in 2000 by Francesc Riverola, a Spanish economist, it has grown to become a world-renowned information website.

Was this article helpful?

We hope you find this article useful. Any comments or suggestions will be greatly appreciated.  
We are also looking for writers with extensive experience in forex and crypto to join us.

please contact us at [email protected].

Thank you for your feedback.

Most viewed

GBP/USD holds below 1.2500 ahead of Fed rate decision

The GBP/USD pair holds below 1.2490 during the early Asian session on Wednesday.
New
update2024.05.01 08:19

EUR/USD tumbles out of recent range, tests below 1.0770 as markets flee into safe havens

EUR/USD slid below the 1.0670 level on Tuesday after an unexpected uptick in US wages growth reignited fears of sticky inflation, chopping down rate cut expectations and sending investors into safe haven bids.
New
update2024.05.01 08:12

New Zealand Unemployment Rate rises to 4.3% in Q1 versus 4.2% expected

The New Zealand Unemployment Rate in the first quarter (Q1) of 2024 climbed to 4.3% from 4.0% in the fourth quarter, according to data published by Statistics New Zealand on Wednesday.
New
update2024.05.01 07:48

NZD/USD Price Analysis: Bears reign supreme, bulls nowhere to be found

The NZD/USD pair plunged to 0.5890 on Tuesday as bears hit the gas and bulls seem to have given up their momentum gained in the last session.
New
update2024.05.01 07:01

Crude Oil slumps on risk aversion, WTI tests $81 per barrel

West Texas Intermediate (WTI) US Crude Oil fell on Tuesday, declining to $81.00 per barrel as investors pulled out of riskier assets and into safe havens like the US Dollar (USD) following an unexpected uptick in wages data, implying inflation will continue to eat away at chances for a near-term rate cut from the Federal Reserve.
New
update2024.05.01 06:44

AUD/JPY Price Analysis: Bears in charge as pair dips toward 102.00

The Aussie Dollar extends its losses against the Japanese Yen for the second straight day, following an intervention by the Bank of Japan (BoJ) on Monday, which kept the pair seesawing in the 101.37/104.95 range.
New
update2024.05.01 06:23

RBNZ's Financial Stability Report: Nominal income increases aiding households transition to higher rates

The Reserve Bank of New Zealand's (RBNZ) latest Financial Stability Report (FSR) highlighted rising incomes aiding households to weather the current environment of higher interest rates, but admitted that many households are still reducing spending and extending payment periods in order to make ends meet.
New
update2024.05.01 06:08

Silver Price Analysis: XAG/USD plunges over 3%, back beneath $27.00

Silver's price dropped sharply late in the North American session, as the Greenback staged a comeback bolstered by the rise in US Treasury yields.
New
update2024.05.01 05:12

NZD/JPY Price Analysis: Buyers step back to consolidate, sellers gain ground

The NZD/JPY pair is down by 0.45% on Tuesday, trading at 92.99.
New
update2024.05.01 04:59

Gold price retreats below $2,300 amid rising US ECI, US Dollar strength

Gold prices drop below the $2,300 threshold on Tuesday as data from the United States (US) show that employment costs are rising, thus putting upward pressure on inflation.
New
update2024.05.01 04:14

Disclaimer:arw

All information and content provided on this website is provided for informational purposes only and is not intended to solicit any investment. Although all efforts are made in order to ensure that the information is correct, no guarantee is provided for the accuracy of any content on this website. Any decision made shall be the responsibility of the investor and Myforex does not take any responsibility whatsoever regarding the use of any information provided herein.

The content provided on this website belongs to Myforex and, where stated, the relevant licensors. All rights are reserved by Myforex and the relevant licensors, and no content of this website, whether in full or in part, shall be copied or displayed elsewhere without the explicit written permission of the relevant copyright holder. If you wish to use any part of the content provided on this website, please ensure that you contact Myforex.

  • Facebook
  • Twitter
  • LINE

Myforex uses cookies to improve the convenience and functionality of this website. This website may include cookies not only by us but also by third parties (advertisers, log analysts, etc.) for the purpose of tracking the activities of users. Cookie policy

I agree
share
Share
Cancel