Select Language

NZD/USD Price Analysis: Downward trend likely to continue despite indicators recovering

Breaking news

NZD/USD Price Analysis: Downward trend likely to continue despite indicators recovering

  • X
  • facebook
  • LINE
  • RSS

  • X
  • facebook
  • LINE
  • RSS
New update 2024.04.18 06:50
NZD/USD Price Analysis: Downward trend likely to continue despite indicators recovering

update 2024.04.18 06:50

  • The RSI on the daily chart lies deep in negative terrain but recovered.
  • The hourly RSI paints a growing buying momentum, trending the positive territory.
  • The MACD on both charts signals a less intense selling momentum.

The NZD/USD stands recovered to 0.5919, it seeing 0.60% gains. The dominant sentiment remains bearish, subtly dominated by sellers due to the consistent positioning beneath key Simple Moving Averages (SMAs). However, indicators on the daily and hourly charts seem to be recovering.

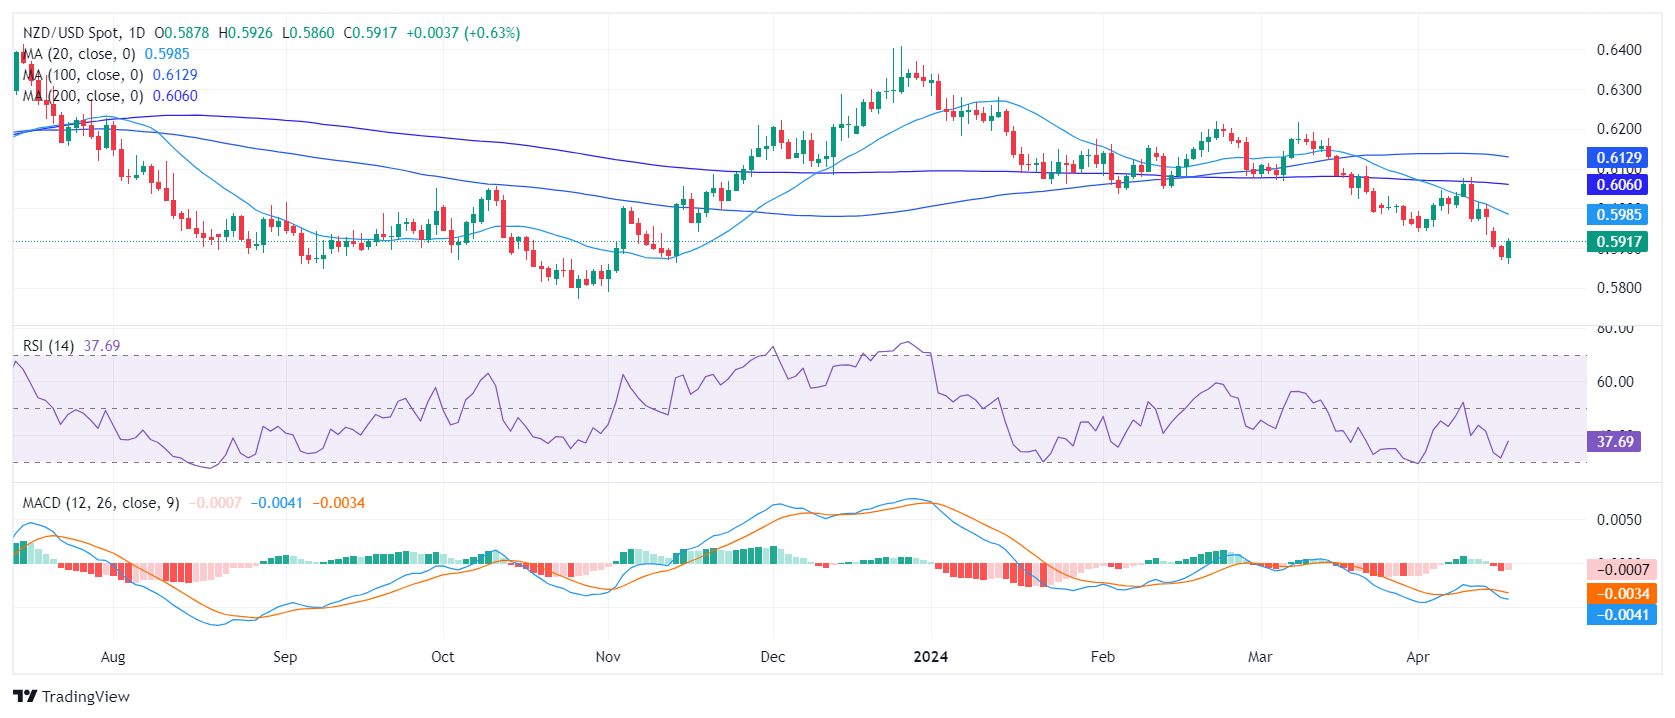
On the daily chart, the Relative Strength Index (RSI) demonstrates a negative sentiment as it continues an under-50 trend. Although there was a slight uptick from the recent low point seen on Monday, the RSI remains in deep in negative territory. Moreover, the Moving Average Convergence Divergence (MACD) displays falling red bars, reinforcing a weakening bearish momentum.

NZD/USD daily chart

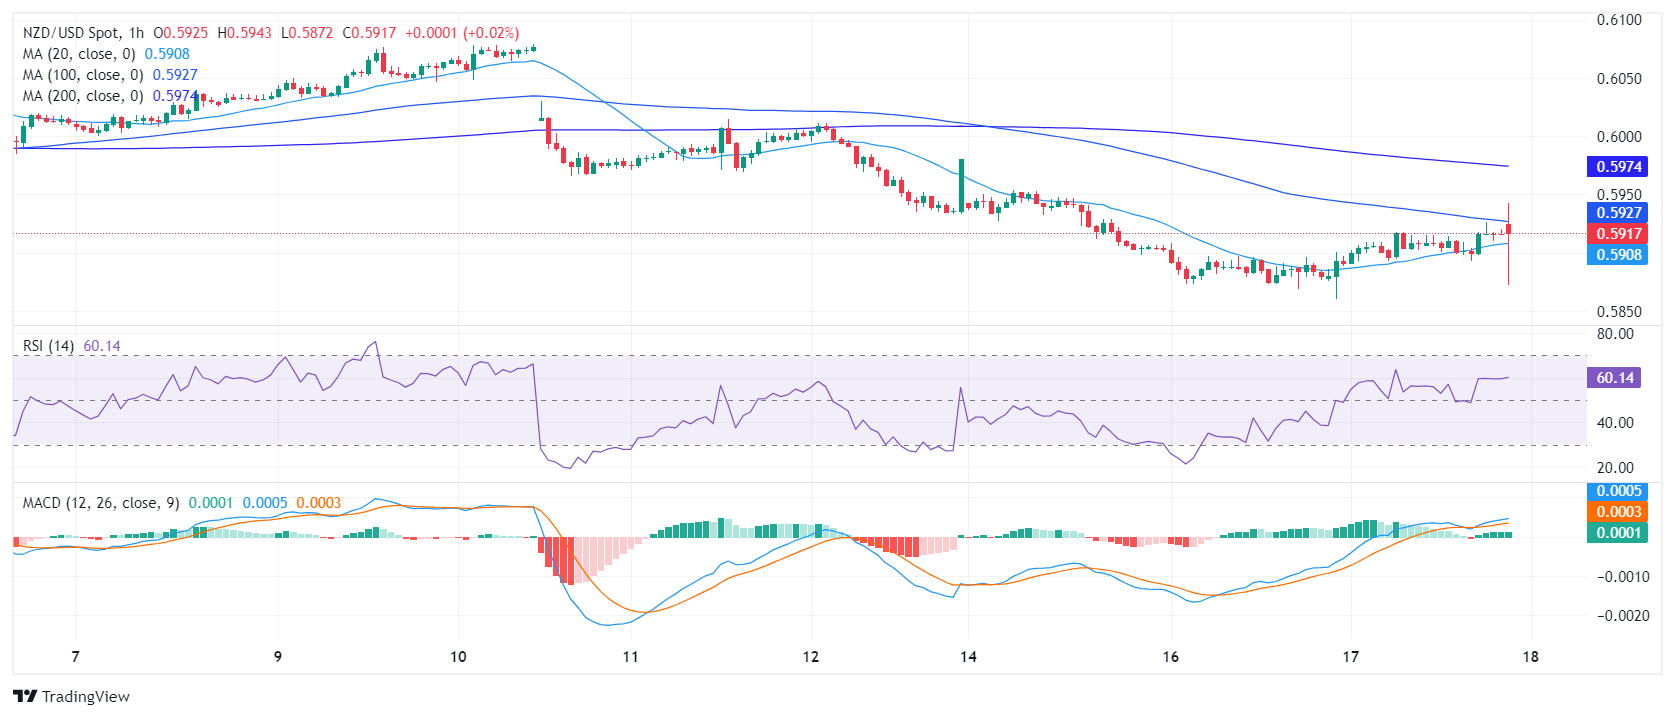
The hourly chart presents an interesting contrast. Here, recent RSI readings consistently float above 50, marking a positive territory. The latest reading is 57, revealing that buyers are taking the reins on the hourly scale. The MACD histogram echoes the buying momentum printing rising green bars.

NZD/USD hourly chart

Upon examining the long-term trend, it becomes apparent that the NZD/USD exhibits bearish momentum as it slots below the 20-day, 100-day, and 200-day Simple Moving Average (SMA) indicators. So any movements which keeps the pair beneath these levels shouldn't be considered as a clear buying signal.

NZD/USD

Overview
Today last price 0.5917
Today Daily Change 0.0037
Today Daily Change % 0.63
Today daily open 0.588
 
Trends
Daily SMA20 0.5993
Daily SMA50 0.6075
Daily SMA100 0.6132
Daily SMA200 0.6062
 
Levels
Previous Daily High 0.5908
Previous Daily Low 0.5868
Previous Weekly High 0.6079
Previous Weekly Low 0.5933
Previous Monthly High 0.6218
Previous Monthly Low 0.5956
Daily Fibonacci 38.2% 0.5884
Daily Fibonacci 61.8% 0.5893
Daily Pivot Point S1 0.5863
Daily Pivot Point S2 0.5846
Daily Pivot Point S3 0.5823
Daily Pivot Point R1 0.5902
Daily Pivot Point R2 0.5925
Daily Pivot Point R3 0.5942


Date

Created

 : 2024.04.18

Update

Last updated

 : 2024.04.18

Related articles


Show more

FXStreet

Financial media

arrow
FXStreet

FXStreet is a forex information website, delivering market analysis and news articles 24/7.
It features a number of articles contributed by well-known analysts, in addition to the ones by its editorial team.
Founded in 2000 by Francesc Riverola, a Spanish economist, it has grown to become a world-renowned information website.

Was this article helpful?

We hope you find this article useful. Any comments or suggestions will be greatly appreciated.  
We are also looking for writers with extensive experience in forex and crypto to join us.

please contact us at [email protected].

Thank you for your feedback.

Most viewed

Forex Today: The Dollar gathers pace ahead of FOMC

Following a negative start to the week, the Greenback managed to regain traction and lifted the USD Index (DXY) back above the 106.00 hurdle sustained by data and cautious trade ahead of the Fed's interest rate decision on Wednesday.
New
update2024.05.01 04:00

EUR/JPY Price Analysis: Bulls maintain control, bears are not done yet and appear to gear up

The EUR/JPY pair stands at 168.11 under strong bull control, reflecting a steady uptrend with a 0.38% gain on Tuesday.
New
update2024.05.01 03:20

Treasury Secretary Yellen: Shelter inflation likely to fall in the next year

According to US Treasury Secretary Yellen, inflation remains high but is assuring markets that data continues to point towards a recovery on US price growth and economic activity.
New
update2024.05.01 03:19

GBP/JPY grinds back above 197.00 after suspected BoJ Yen intervention

GBP/JPY is grinding its way back up the charts on Tuesday, testing chart territory north of 197.00 after the pair got knocked down from 34-year highs at 200.60 earlier this week.
New
update2024.05.01 03:03

Mexican Peso declines against US Dollar as Q1 GDP misses forecasts

The Mexican Peso tumbles more than 0.41% against the US Dollar on Tuesday, following the release of Mexico's Gross Domestic Product (GDP) figures missing estimates for the first quarter on a yearly basis.
New
update2024.05.01 02:00

Dow Jones Industrial Average declines as risk appetite sours on Tuesday

The Dow Jones Industrial Average (DJIA) declined alongside the other major US equity indexes as risk aversion strikes again just ahead of Wednesday's latest Federal Reserve (Fed) rate call.
New
update2024.05.01 01:22

US Dollar gains momentum following strong employment and confidence data

The US Dollar Index (DXY) is presently trading higher at 105.95, while the two-day Federal Reserve (Fed) meeting kicked off.
New
update2024.05.01 01:15

Canadian Dollar falls back on Tuesday amid broad-market Greenback bidding

The Canadian Dollar (CAD) eased against the Greenback on Tuesday after the American market session kicked the day off with a risk-off push after US wages outpaced expectations.
New
update2024.05.01 00:42

GBP/USD Price Analysis: Drops below 200-DMA, at cross-roads to resume downtrend

The Pound Sterling reverses its course against the US Dollar, after extending its gains past the 200-day moving average (DMA).
New
update2024.04.30 23:57

US CB Consumer Confidence declines to 97.0 in April

Consumer sentiment in the US weakened in April, with the Conference Board's Consumer Confidence Index dropping to 97.0, the lowest reading since July 2022, from 103.1 (revised from 104.7) in March.
New
update2024.04.30 23:07

Disclaimer:arw

All information and content provided on this website is provided for informational purposes only and is not intended to solicit any investment. Although all efforts are made in order to ensure that the information is correct, no guarantee is provided for the accuracy of any content on this website. Any decision made shall be the responsibility of the investor and Myforex does not take any responsibility whatsoever regarding the use of any information provided herein.

The content provided on this website belongs to Myforex and, where stated, the relevant licensors. All rights are reserved by Myforex and the relevant licensors, and no content of this website, whether in full or in part, shall be copied or displayed elsewhere without the explicit written permission of the relevant copyright holder. If you wish to use any part of the content provided on this website, please ensure that you contact Myforex.

  • Facebook
  • Twitter
  • LINE

Myforex uses cookies to improve the convenience and functionality of this website. This website may include cookies not only by us but also by third parties (advertisers, log analysts, etc.) for the purpose of tracking the activities of users. Cookie policy

I agree
share
Share
Cancel