Created
: 2024.04.10


![]() 2024.04.10 23:04
2024.04.10 23:04
Siver price (XAG/USD) retreats from fresh two-year high of $28.36 after the United States Bureau of Labor Statistics (BLS) reported that the consumer price inflation turns out sticky. Hot inflation figures combined with strong payroll data for March have dented market expectations for the Federal Reserve (Fed) to begin lowering interest rates from the June meeting.
The annual headline Consumer Price Index (CPI) accelerated to 3.5% from expectations of 3.4% and the prior reading of 3.2%. Annual core inflation that excludes volatile food and energy prices rose steadily by 3.8%. Economists expected the most sought-after inflation measure to decelerate to 3.7%.
Fed policymakers have been reiterating that it is not appropriate to reduce interest rates until they get convinced that inflation will return sustainably to the 2% target. For inflation to return to 2%, the monthly inflation should increase at a pace of 0.17%. In March, both headline and core CPI rose steadily by 0.4% against expectations of 0.3%.
Going forward, traders are expected to shift their bets for the Fed beginning to reduce interest rates in the third quarter this year. Stubbornly higher inflation is expected to deepen uncertainty over three rate cut projections for this year as anticipated by Fed policymakers in the latest dot plot.
Hot CPI figures have led to a sharp increase in yields on interest-bearing assets, such as US bonds. 10-year US Treasury yields have risen to 4.48%. The US Dollar Index (DXY) rallies to the crucial resistance of 105.00.
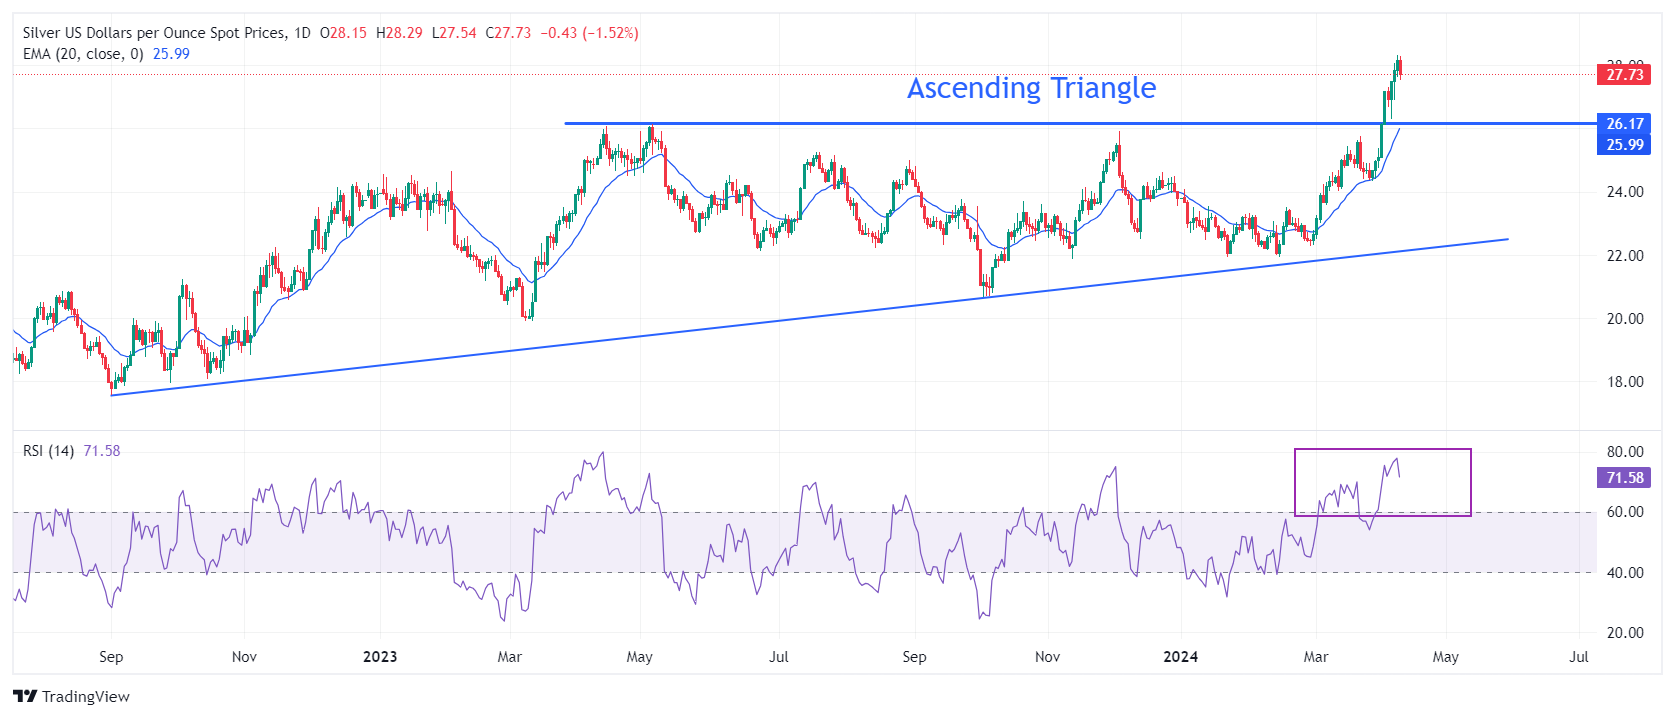
Silver price delivers a stalwart rally after a breakout of the Ascending Triangle chart pattern formed on a daily timeframe. The strength of the breakout will be tested if the white metal corrects to the horizontal resistance of the above-mentioned chart pattern plotted from 14 April 2023 high at $26.09. Upward-sloping 20-day Exponential Moving Average (EMA) at $26.00 suggests that the near-term demand remains upbeat.
The 14-period Relative Strength Index (RSI) drops after reaching 76.00, indicating that oscillators are cooling after turning extremely overbought.
![]()
Created
: 2024.04.10
![]()
Last updated
: 2024.04.10

FXStreet is a forex information website, delivering market analysis and news articles 24/7.
It features a number of articles contributed by well-known analysts, in addition to the ones by its editorial team.
Founded in 2000 by Francesc Riverola, a Spanish economist, it has grown to become a world-renowned information website.
We hope you find this article useful. Any comments or suggestions will be greatly appreciated.
We are also looking for writers with extensive experience in forex and crypto to join us.
please contact us at [email protected].
Disclaimer:![]()
All information and content provided on this website is provided for informational purposes only and is not intended to solicit any investment. Although all efforts are made in order to ensure that the information is correct, no guarantee is provided for the accuracy of any content on this website. Any decision made shall be the responsibility of the investor and Myforex does not take any responsibility whatsoever regarding the use of any information provided herein.
The content provided on this website belongs to Myforex and, where stated, the relevant licensors. All rights are reserved by Myforex and the relevant licensors, and no content of this website, whether in full or in part, shall be copied or displayed elsewhere without the explicit written permission of the relevant copyright holder. If you wish to use any part of the content provided on this website, please ensure that you contact Myforex.
Myforex uses cookies to improve the convenience and functionality of this website. This website may include cookies not only by us but also by third parties (advertisers, log analysts, etc.) for the purpose of tracking the activities of users. Cookie policy
