Select Language

EUR/GBP Price Analysis: Bearish sentiment prevails, daily and hourly trends lean negative

Breaking news

EUR/GBP Price Analysis: Bearish sentiment prevails, daily and hourly trends lean negative

  • X
  • facebook
  • LINE
  • RSS

  • X
  • facebook
  • LINE
  • RSS
New update 2024.03.29 21:33
EUR/GBP Price Analysis: Bearish sentiment prevails, daily and hourly trends lean negative

update 2024.03.29 21:33

  • The daily chart reveals a mostly bearish environment with somewhat flat indicators.
  • The hourly chart analysis depicts a potential bearish shift with the RSI reading close to the neutral-negative zone.

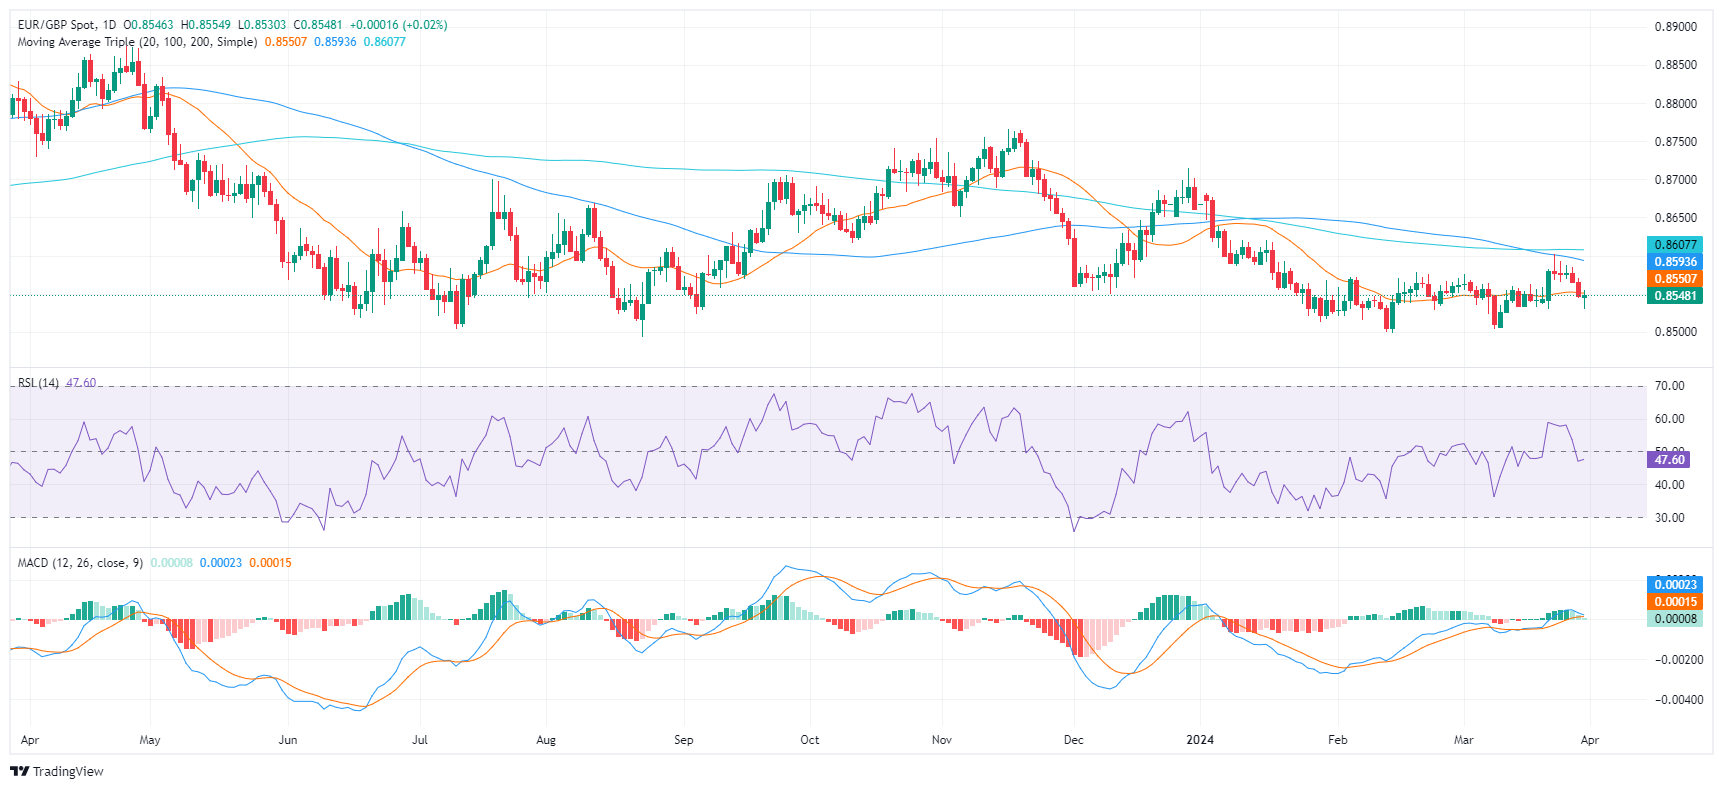
The EUR/GBP pair is currently trading at 0.8550, with minor losses on Friday's session. The sellers are exerting their presence as bullish momentum remains weak and the fact that the cross remains below its main Simple Moving Averages (SMAs) of 20,100 and 200-days contributes to the bearish bias.

On the daily chart, the Relative Strength Index (RSI) currently resides in negative territory but stands flat while the Moving Average Convergence Divergence (MACD) prints neutral green bars, suggesting stagnant momentum. This demonstrates the trend might continue in the near term.

EUR/GBP daily chart

Moving to the hourly chart, the RSI shows a mixed trend with readings ranging from 33 and then recovering to 50 standing on the edge of the neutral-negative territory. Coupled with flat green bars on the MACD histogram, there might be a shift towards a bearish momentum after the bulls' short recovery during the European session.

EUR/GBP hourly chart

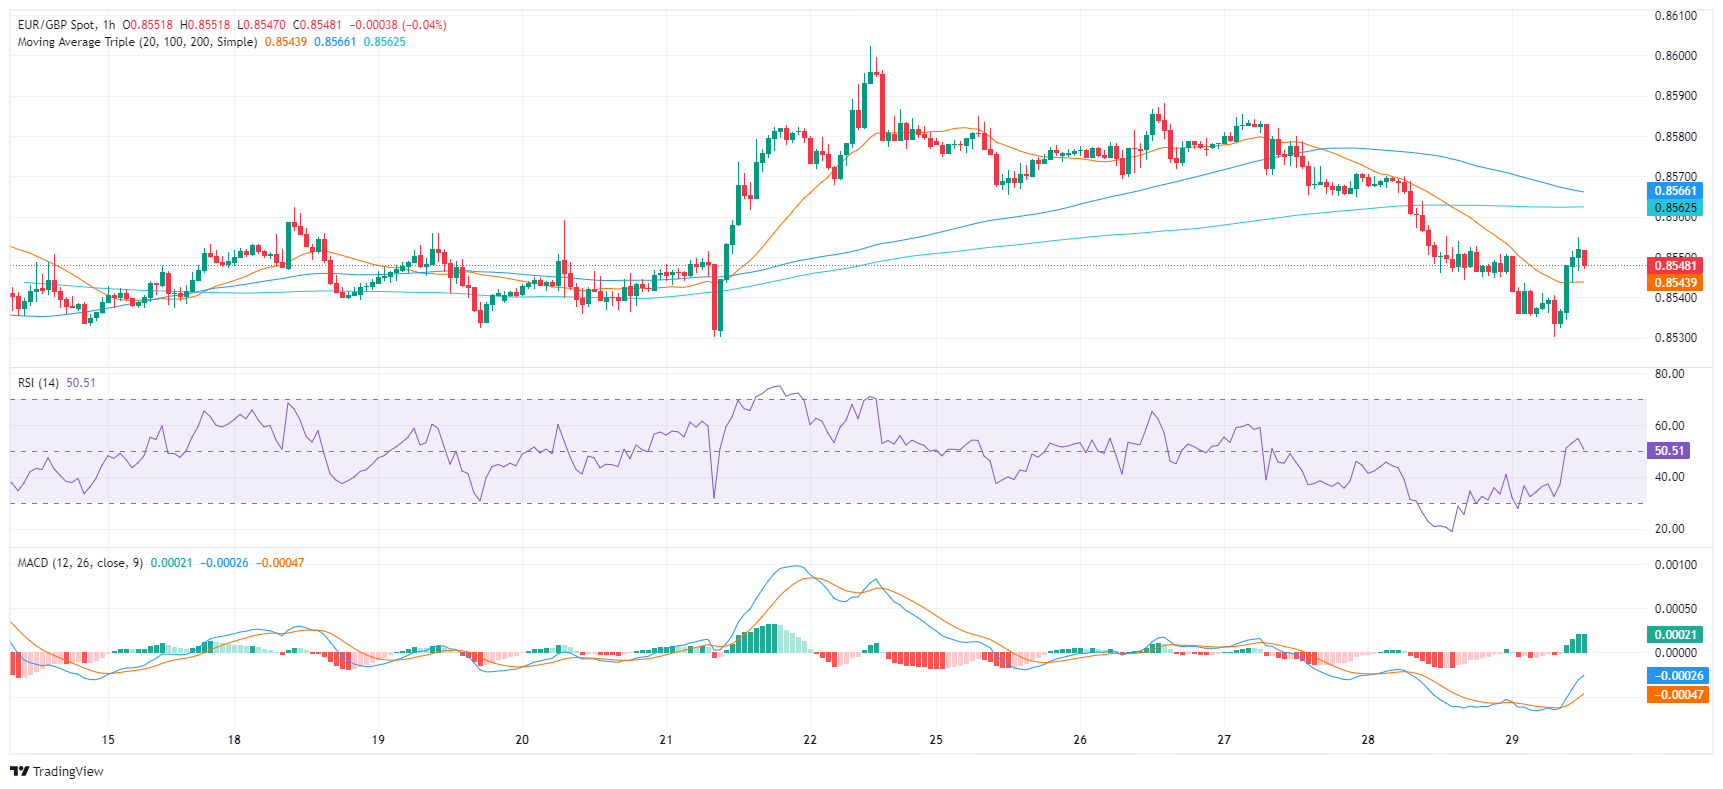
In conclusion, both the daily and hourly analyses point to a primarily negative trend for EUR/GBP, albeit with potential hourly fluctuations. If the buyers want to avoid losses they should reclaim the 200-day SMA around 0.8550 and build support around it.

EUR/GBP

Overview
Today last price 0.8548
Today Daily Change 0.0002
Today Daily Change % 0.02
Today daily open 0.8546
 
Trends
Daily SMA20 0.8551
Daily SMA50 0.8548
Daily SMA100 0.8595
Daily SMA200 0.8608
 
Levels
Previous Daily High 0.8571
Previous Daily Low 0.8544
Previous Weekly High 0.8602
Previous Weekly Low 0.853
Previous Monthly High 0.8578
Previous Monthly Low 0.8498
Daily Fibonacci 38.2% 0.8554
Daily Fibonacci 61.8% 0.8561
Daily Pivot Point S1 0.8537
Daily Pivot Point S2 0.8527
Daily Pivot Point S3 0.851
Daily Pivot Point R1 0.8564
Daily Pivot Point R2 0.858
Daily Pivot Point R3 0.859


Date

Created

 : 2024.03.29

Update

Last updated

 : 2024.03.29

Related articles


Show more

FXStreet

Financial media

arrow
FXStreet

FXStreet is a forex information website, delivering market analysis and news articles 24/7.
It features a number of articles contributed by well-known analysts, in addition to the ones by its editorial team.
Founded in 2000 by Francesc Riverola, a Spanish economist, it has grown to become a world-renowned information website.

Was this article helpful?

We hope you find this article useful. Any comments or suggestions will be greatly appreciated.  
We are also looking for writers with extensive experience in forex and crypto to join us.

please contact us at [email protected].

Thank you for your feedback.

Most viewed

EUR/JPY Price Analysis: Bullish run faces overbought risks, hovers around 169.00

The EUR/JPY rallies toward the 169.00 figure yet remains shy of breaching it as risk appetite improves, as Wall Street depicts.
New
update2024.04.27 05:45

Mexican Peso gains ground against US Dollar amid mixed US data

The Mexican Peso counterattacks registered solid gains versus the US Dollar on Friday as economic data from the United States (US) showed that inflation edged slightly up, while Mexico's Trade Balance registered a trade deficit in March.
New
update2024.04.27 05:03

GBP/JPY breaches 197.00 for the first time since 2008

GBP/JPY touched chart territory above 197.00 for the first time since September of 2008 as markets meet the Bank of Japan (BoJ) head-on and batter the Yen into decades-long lows.
New
update2024.04.27 04:56

Dow Jones Industrial Average climbs back over 38,300 as investors shrug off still-high PCE inflation

The Dow Jones Industrial Average (DJIA) churned on Friday before pushing into the high end for the day as investors shake off still-high US Personal Consumption Expenditure (PCE) Price Index inflation.
New
update2024.04.27 03:02

Silver Price Analysis: XAG/USD dips amid strong US Dollar, warmer inflation

Silver's price dropped 0.79% after hitting a daily high of $27.73, as another inflation report in the United States showed warmer-than-expected inflation.
New
update2024.04.27 02:44

GBP/USD Price Analysis: Tumbles below 1.2500 as bears cut bulls hopes short

During the mid-North American session, the Pound Sterling retreats and registers losses against the US Dollar, slumping below 1.2500.
update2024.04.27 01:37

Forecasting the Coming Week: The FOMC and NFP take centre stage

The Greenback transited another week where data releases and expectations of interest rate cuts by the Federal Reserve remained at the centre of the debate.
update2024.04.27 01:37

Canadian Dollar follows broader market flows as investors grapple with US PCE inflation

The Canadian Dollar (CAD) is taking a back seat to broader market flows on Friday as investor focus remains pinned on decaying hopes for a rate cut from the Federal Reserve (Fed).
update2024.04.27 01:33

Silver Price Forecast: XAG/USD remains sideways near $27.60 as investors reassess Fed rate cut bets

Silver price (XAG/USD) remains stuck in a tight range around $27.60 in Friday's American session.
update2024.04.26 22:53

AUD/USD continues rising after US core PCE beats estimates with fifth up-day in a row

AUD/USD trades in the 0.6540s as it continues rallying after the release of US core Personal Consumption Expenditures Price (PCE) Index data for March.
update2024.04.26 22:42

Disclaimer:arw

All information and content provided on this website is provided for informational purposes only and is not intended to solicit any investment. Although all efforts are made in order to ensure that the information is correct, no guarantee is provided for the accuracy of any content on this website. Any decision made shall be the responsibility of the investor and Myforex does not take any responsibility whatsoever regarding the use of any information provided herein.

The content provided on this website belongs to Myforex and, where stated, the relevant licensors. All rights are reserved by Myforex and the relevant licensors, and no content of this website, whether in full or in part, shall be copied or displayed elsewhere without the explicit written permission of the relevant copyright holder. If you wish to use any part of the content provided on this website, please ensure that you contact Myforex.

  • Facebook
  • Twitter
  • LINE

Myforex uses cookies to improve the convenience and functionality of this website. This website may include cookies not only by us but also by third parties (advertisers, log analysts, etc.) for the purpose of tracking the activities of users. Cookie policy

I agree
share
Share
Cancel