Select Language

NZD/JPY Price Analysis: Bears maintain control, pushes cross below the 100-day SMA

Breaking news

NZD/JPY Price Analysis: Bears maintain control, pushes cross below the 100-day SMA

  • X
  • facebook
  • LINE
  • RSS

  • X
  • facebook
  • LINE
  • RSS
New update 2024.03.29 06:31
NZD/JPY Price Analysis: Bears maintain control, pushes cross below the 100-day SMA

update 2024.03.29 06:31

  • Daily chart signals rising selling traction with the pair now below the key level of 90.50.
  • Hourly chart indicators depict a potential consolidation period with indicators somewhat flat.
  • The last hope for the cross is now the 200-day SMA.

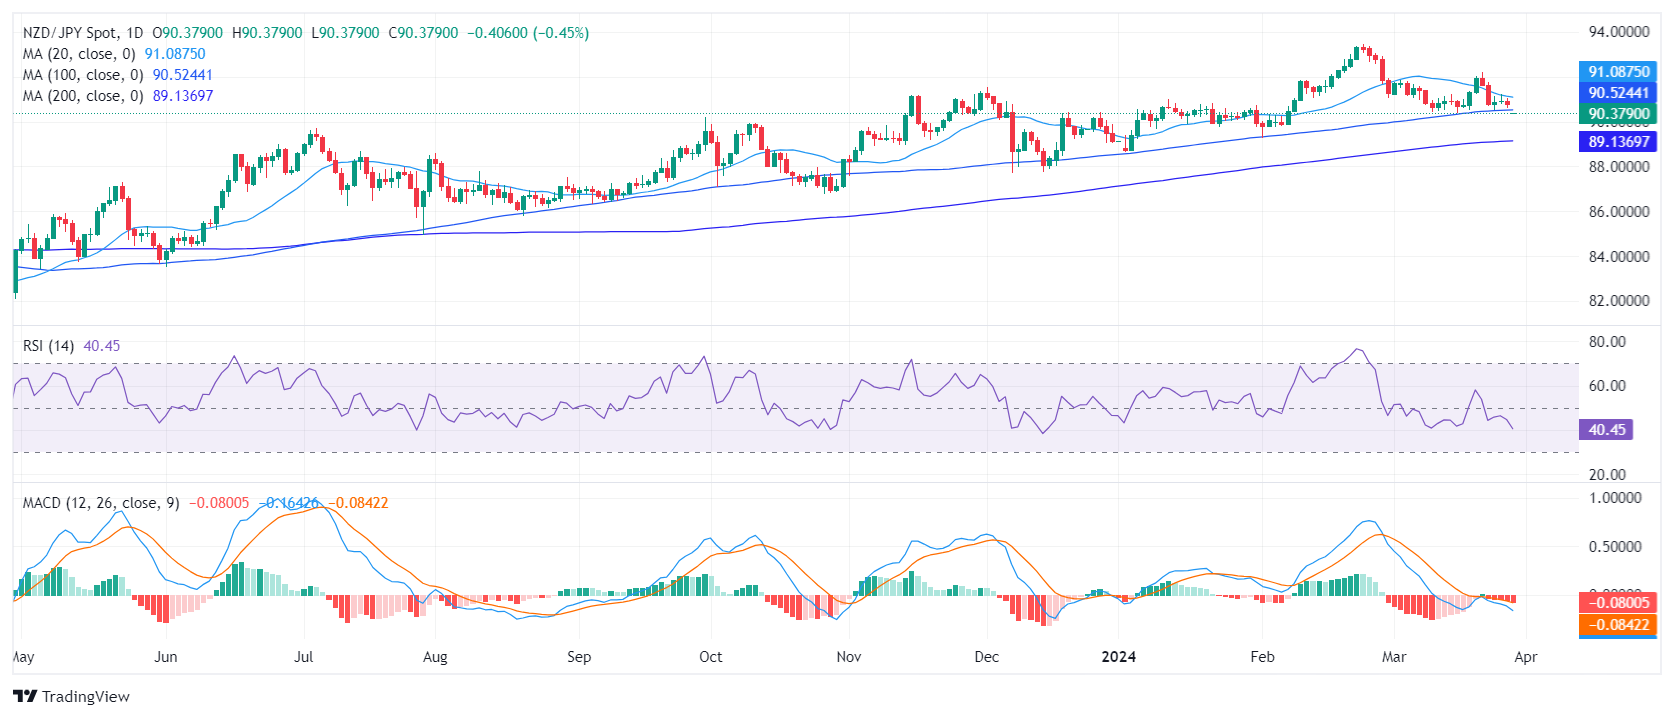
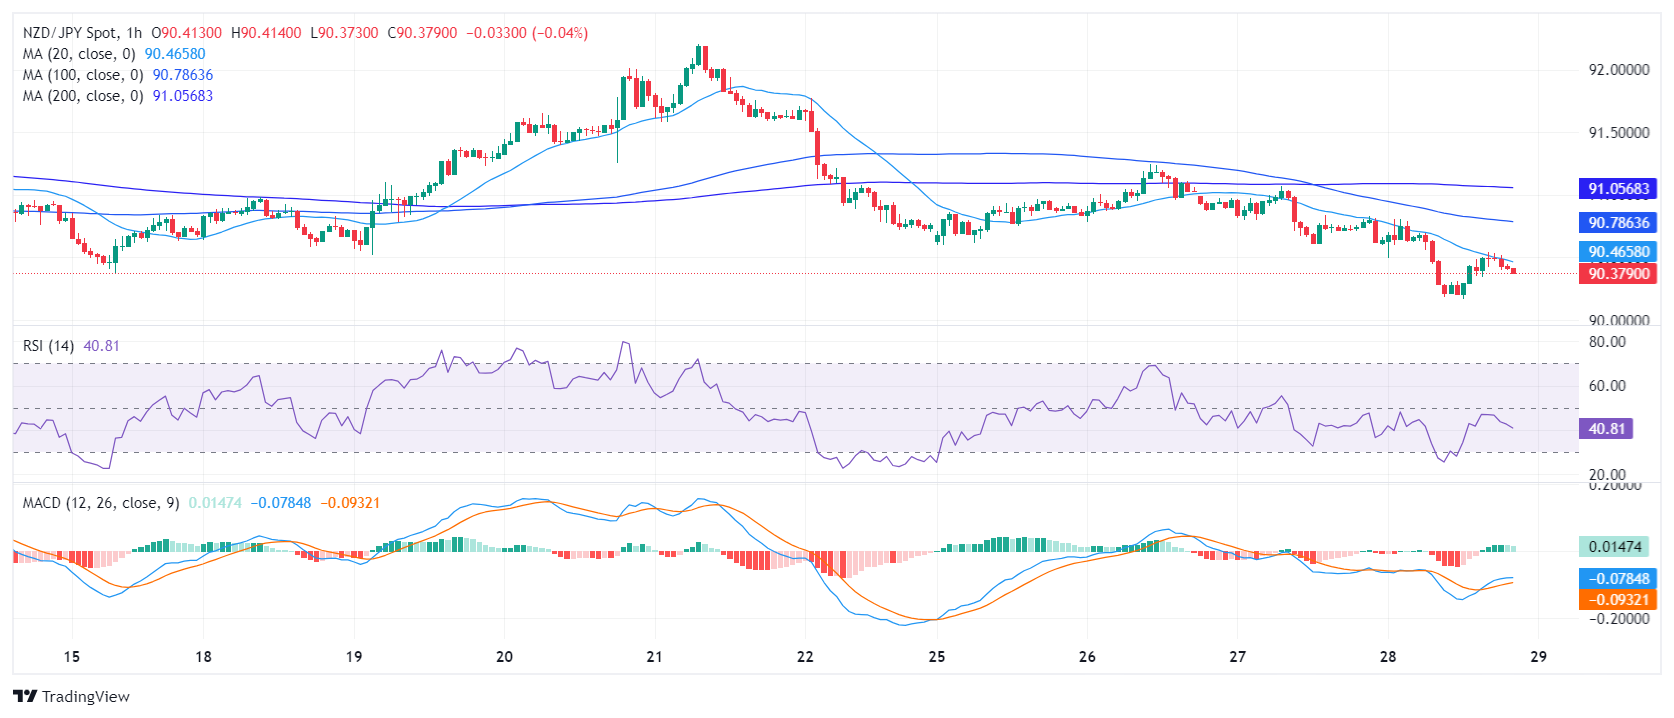
In Thursday's session, the NZD/JPY declined to 90.40, with a decline of 0.43%. Bears are in control after successfully conquering the 100-day Simple Moving Average (SMA) while the selling momentum seems to have flattened on the hourly time frame.

On the daily chart, the NZD/JPY pair exhibits a faltering momentum. Despite intermittent upticks, the Relative Strength Index (RSI) has spent much of the last sessions in negative territory, indicating a dominance of sellers. The Moving Average Convergence Divergence (MACD) complements this view as it showcases rising red bars, pointing toward an increase in negative momentum.

NZD/JPY daily chart

Switching to the hourly chart, RSI values are mildly oscillating in the negative territory with the latest reading clocked at 42. The hourly MACD histogram adds to the complexity as it reveals green bars that suggest the downward momentum might be slowing. Comparing the daily and hourly charts, contrasting signals hint at a period of consolidation for NZD/JPY before a clearer direction emerges.

NZD/JPY hourly chart

On a larger scale, the pair resides now below the 20 and 100-day Simple Moving Averages (SMAs), indicating bearishness. Yet, its position above the 200-day SMA adds a hint of bullish potential. However, as bearish momentum is growing, the sellers might attack the longer moving average to confirm the negative trend.

NZD/JPY

Overview
Today last price 90.4
Today Daily Change -0.38
Today Daily Change % -0.42
Today daily open 90.78
 
Trends
Daily SMA20 91.13
Daily SMA50 91.17
Daily SMA100 90.51
Daily SMA200 89.13
 
Levels
Previous Daily High 91.07
Previous Daily Low 90.61
Previous Weekly High 92.2
Previous Weekly Low 90.52
Previous Monthly High 93.45
Previous Monthly Low 89.26
Daily Fibonacci 38.2% 90.79
Daily Fibonacci 61.8% 90.9
Daily Pivot Point S1 90.57
Daily Pivot Point S2 90.36
Daily Pivot Point S3 90.11
Daily Pivot Point R1 91.03
Daily Pivot Point R2 91.28
Daily Pivot Point R3 91.49


Date

Created

 : 2024.03.29

Update

Last updated

 : 2024.03.29

Related articles


Show more

FXStreet

Financial media

arrow
FXStreet

FXStreet is a forex information website, delivering market analysis and news articles 24/7.
It features a number of articles contributed by well-known analysts, in addition to the ones by its editorial team.
Founded in 2000 by Francesc Riverola, a Spanish economist, it has grown to become a world-renowned information website.

Was this article helpful?

We hope you find this article useful. Any comments or suggestions will be greatly appreciated.  
We are also looking for writers with extensive experience in forex and crypto to join us.

please contact us at [email protected].

Thank you for your feedback.

Most viewed

EUR/JPY Price Analysis: Bullish run faces overbought risks, hovers around 169.00

The EUR/JPY rallies toward the 169.00 figure yet remains shy of breaching it as risk appetite improves, as Wall Street depicts.
New
update2024.04.27 05:45

Mexican Peso gains ground against US Dollar amid mixed US data

The Mexican Peso counterattacks registered solid gains versus the US Dollar on Friday as economic data from the United States (US) showed that inflation edged slightly up, while Mexico's Trade Balance registered a trade deficit in March.
New
update2024.04.27 05:03

GBP/JPY breaches 197.00 for the first time since 2008

GBP/JPY touched chart territory above 197.00 for the first time since September of 2008 as markets meet the Bank of Japan (BoJ) head-on and batter the Yen into decades-long lows.
New
update2024.04.27 04:56

Dow Jones Industrial Average climbs back over 38,300 as investors shrug off still-high PCE inflation

The Dow Jones Industrial Average (DJIA) churned on Friday before pushing into the high end for the day as investors shake off still-high US Personal Consumption Expenditure (PCE) Price Index inflation.
New
update2024.04.27 03:02

Silver Price Analysis: XAG/USD dips amid strong US Dollar, warmer inflation

Silver's price dropped 0.79% after hitting a daily high of $27.73, as another inflation report in the United States showed warmer-than-expected inflation.
New
update2024.04.27 02:44

GBP/USD Price Analysis: Tumbles below 1.2500 as bears cut bulls hopes short

During the mid-North American session, the Pound Sterling retreats and registers losses against the US Dollar, slumping below 1.2500.
update2024.04.27 01:37

Forecasting the Coming Week: The FOMC and NFP take centre stage

The Greenback transited another week where data releases and expectations of interest rate cuts by the Federal Reserve remained at the centre of the debate.
update2024.04.27 01:37

Canadian Dollar follows broader market flows as investors grapple with US PCE inflation

The Canadian Dollar (CAD) is taking a back seat to broader market flows on Friday as investor focus remains pinned on decaying hopes for a rate cut from the Federal Reserve (Fed).
update2024.04.27 01:33

Silver Price Forecast: XAG/USD remains sideways near $27.60 as investors reassess Fed rate cut bets

Silver price (XAG/USD) remains stuck in a tight range around $27.60 in Friday's American session.
update2024.04.26 22:53

AUD/USD continues rising after US core PCE beats estimates with fifth up-day in a row

AUD/USD trades in the 0.6540s as it continues rallying after the release of US core Personal Consumption Expenditures Price (PCE) Index data for March.
update2024.04.26 22:42

Disclaimer:arw

All information and content provided on this website is provided for informational purposes only and is not intended to solicit any investment. Although all efforts are made in order to ensure that the information is correct, no guarantee is provided for the accuracy of any content on this website. Any decision made shall be the responsibility of the investor and Myforex does not take any responsibility whatsoever regarding the use of any information provided herein.

The content provided on this website belongs to Myforex and, where stated, the relevant licensors. All rights are reserved by Myforex and the relevant licensors, and no content of this website, whether in full or in part, shall be copied or displayed elsewhere without the explicit written permission of the relevant copyright holder. If you wish to use any part of the content provided on this website, please ensure that you contact Myforex.

  • Facebook
  • Twitter
  • LINE

Myforex uses cookies to improve the convenience and functionality of this website. This website may include cookies not only by us but also by third parties (advertisers, log analysts, etc.) for the purpose of tracking the activities of users. Cookie policy

I agree
share
Share
Cancel