Select Language

EUR/JPY Price Analysis: Bearish short-term trend surfaces, bullish outlook holds for broader timeframe

Breaking news

EUR/JPY Price Analysis: Bearish short-term trend surfaces, bullish outlook holds for broader timeframe

  • X
  • facebook
  • LINE
  • RSS

  • X
  • facebook
  • LINE
  • RSS
New update 2024.03.29 03:16
EUR/JPY Price Analysis: Bearish short-term trend surfaces, bullish outlook holds for broader timeframe

update 2024.03.29 03:16

  • Even though daily chart indicators reveal weakening momentum, the overall trend remains positive.
  • In the hourly chart, the RSI deep in the negative area implies sellers are in charge during the day's trading.
  • To maintain momentum, the bulls need to defend the 20-day SMA.

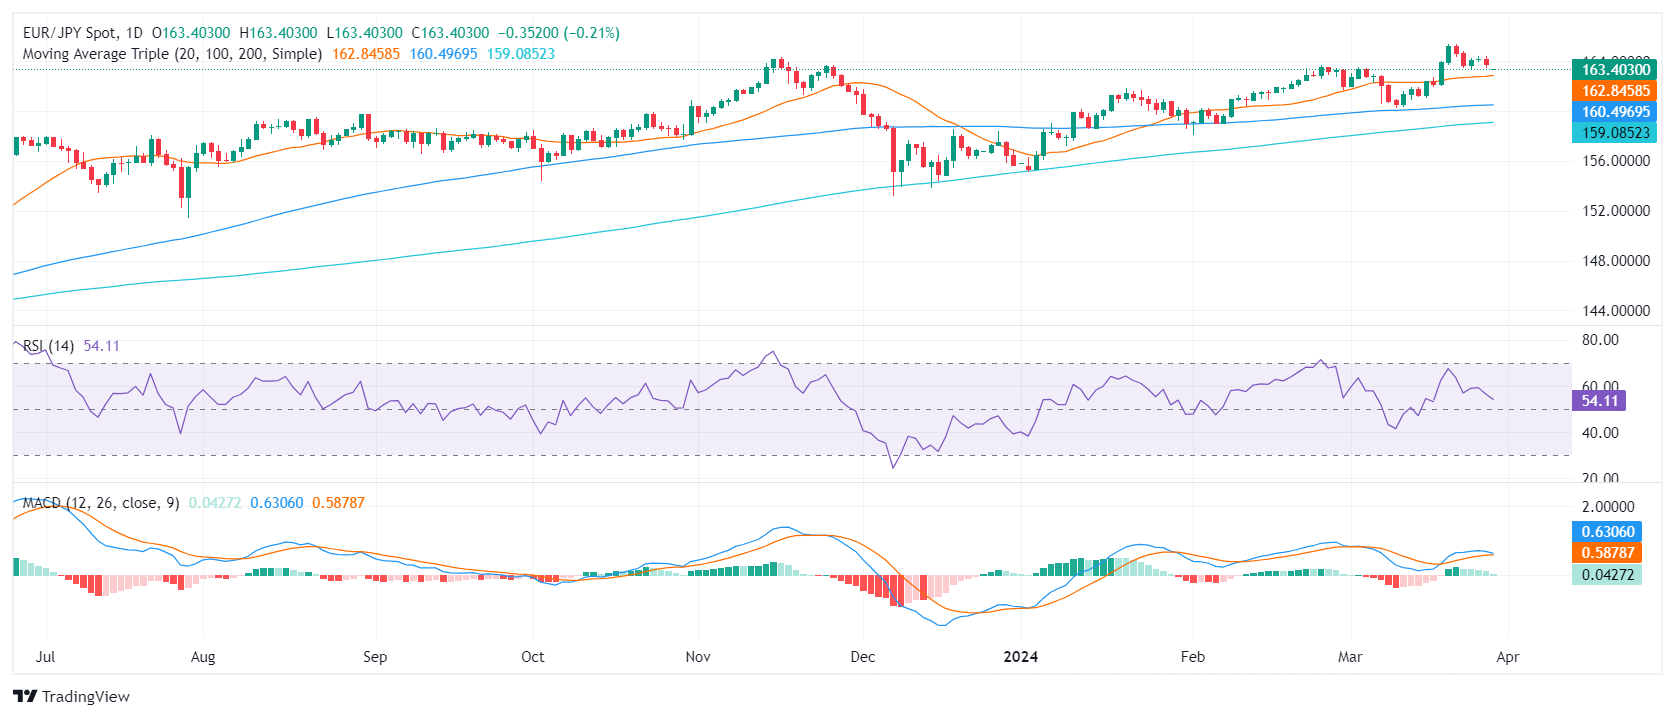
In Thursday's session, the EUR/JPY pair is trading at around 163.40, experiencing a minor loss. The broader perspective leans in favor of the bulls, indicating buying strength that keeps the pair above its 20, 100, and 200-day Simple Moving Averages (SMAs). Despite this, there is evidence of mounting selling pressure on the daily chart.

On the daily chart, the Relative Strength Index (RSI) descended from nearing overbought conditions last week towards 54. The MACD histogram also indicates that buyer momentum might be waning, as inferred from the flat green bars. These market indicators suggest potential near-term volatility in the pair's direction.

EUR/JPY daily chart

Transitioning to the hourly chart, RSI readings convey a more negative sentiment. The latest value stands at 44, signaling sellers as dominant in the short-term movements. The MACD histogram, however, prints green bars which adds neutrality to the intraday outlook.

EUR/JPY hourly chart

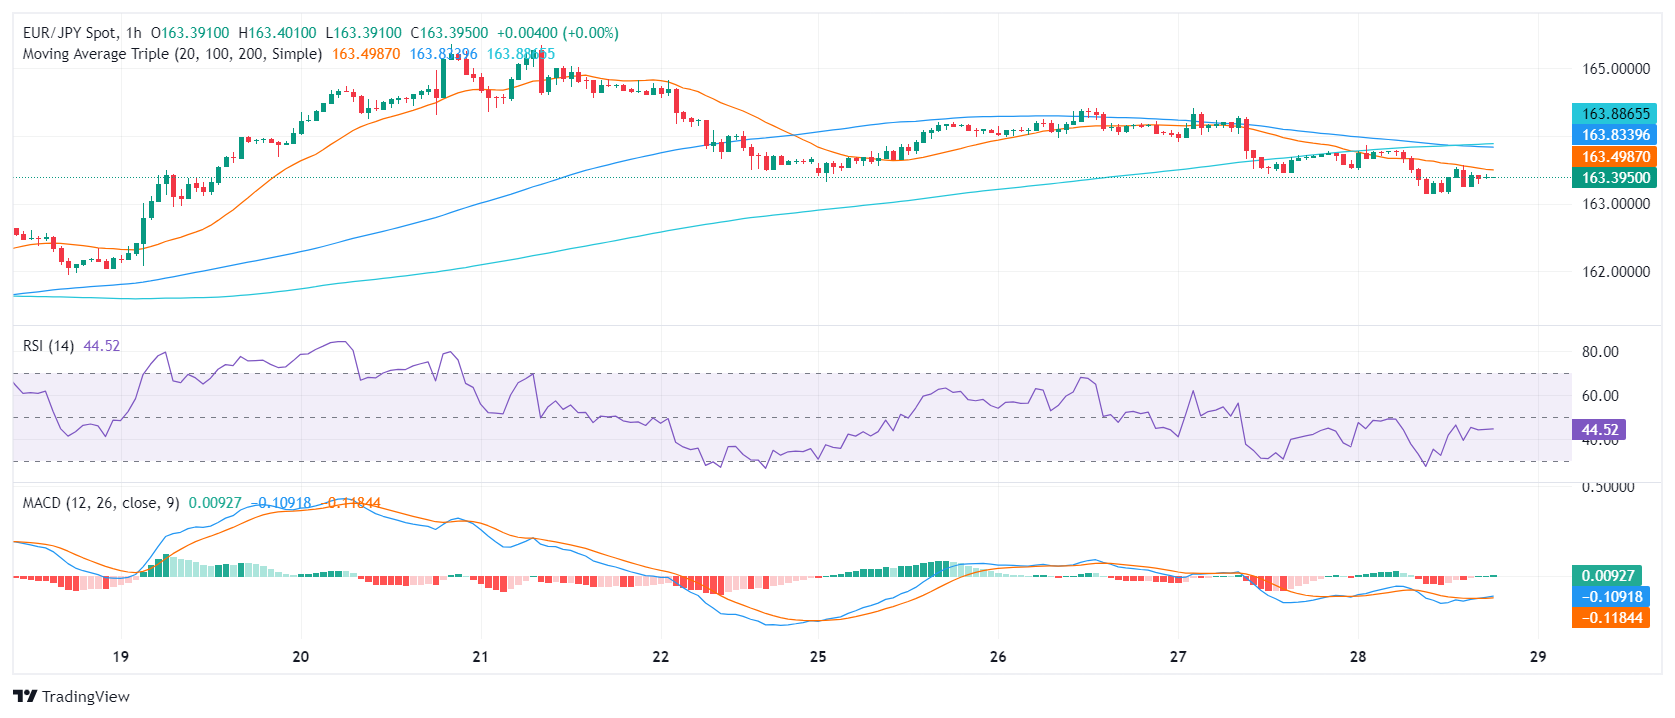
In conclusion, despite the negative sentiment on the hourly chart, the daily and broader metrics suggest that bulls maintain control of the bigger picture. The main task fo the buyers is to defend the 20-day SMA at around 163.00 and as long as the pair remains above this level, the outlook will be positive.


EUR/JPY

Overview
Today last price 163.39
Today Daily Change -0.37
Today Daily Change % -0.23
Today daily open 163.76
 
Trends
Daily SMA20 162.78
Daily SMA50 161.79
Daily SMA100 160.48
Daily SMA200 159.05
 
Levels
Previous Daily High 164.42
Previous Daily Low 163.44
Previous Weekly High 165.36
Previous Weekly Low 161.95
Previous Monthly High 163.72
Previous Monthly Low 158.08
Daily Fibonacci 38.2% 163.81
Daily Fibonacci 61.8% 164.05
Daily Pivot Point S1 163.32
Daily Pivot Point S2 162.89
Daily Pivot Point S3 162.34
Daily Pivot Point R1 164.3
Daily Pivot Point R2 164.85
Daily Pivot Point R3 165.28


Date

Created

 : 2024.03.29

Update

Last updated

 : 2024.03.29

Related articles


Show more

FXStreet

Financial media

arrow
FXStreet

FXStreet is a forex information website, delivering market analysis and news articles 24/7.
It features a number of articles contributed by well-known analysts, in addition to the ones by its editorial team.
Founded in 2000 by Francesc Riverola, a Spanish economist, it has grown to become a world-renowned information website.

Was this article helpful?

We hope you find this article useful. Any comments or suggestions will be greatly appreciated.  
We are also looking for writers with extensive experience in forex and crypto to join us.

please contact us at [email protected].

Thank you for your feedback.

Most viewed

EUR/JPY Price Analysis: Bullish run faces overbought risks, hovers around 169.00

The EUR/JPY rallies toward the 169.00 figure yet remains shy of breaching it as risk appetite improves, as Wall Street depicts.
New
update2024.04.27 05:45

Mexican Peso gains ground against US Dollar amid mixed US data

The Mexican Peso counterattacks registered solid gains versus the US Dollar on Friday as economic data from the United States (US) showed that inflation edged slightly up, while Mexico's Trade Balance registered a trade deficit in March.
New
update2024.04.27 05:03

GBP/JPY breaches 197.00 for the first time since 2008

GBP/JPY touched chart territory above 197.00 for the first time since September of 2008 as markets meet the Bank of Japan (BoJ) head-on and batter the Yen into decades-long lows.
New
update2024.04.27 04:56

Dow Jones Industrial Average climbs back over 38,300 as investors shrug off still-high PCE inflation

The Dow Jones Industrial Average (DJIA) churned on Friday before pushing into the high end for the day as investors shake off still-high US Personal Consumption Expenditure (PCE) Price Index inflation.
New
update2024.04.27 03:02

Silver Price Analysis: XAG/USD dips amid strong US Dollar, warmer inflation

Silver's price dropped 0.79% after hitting a daily high of $27.73, as another inflation report in the United States showed warmer-than-expected inflation.
New
update2024.04.27 02:44

GBP/USD Price Analysis: Tumbles below 1.2500 as bears cut bulls hopes short

During the mid-North American session, the Pound Sterling retreats and registers losses against the US Dollar, slumping below 1.2500.
New
update2024.04.27 01:37

Forecasting the Coming Week: The FOMC and NFP take centre stage

The Greenback transited another week where data releases and expectations of interest rate cuts by the Federal Reserve remained at the centre of the debate.
New
update2024.04.27 01:37

Canadian Dollar follows broader market flows as investors grapple with US PCE inflation

The Canadian Dollar (CAD) is taking a back seat to broader market flows on Friday as investor focus remains pinned on decaying hopes for a rate cut from the Federal Reserve (Fed).
New
update2024.04.27 01:33

Silver Price Forecast: XAG/USD remains sideways near $27.60 as investors reassess Fed rate cut bets

Silver price (XAG/USD) remains stuck in a tight range around $27.60 in Friday's American session.
New
update2024.04.26 22:53

AUD/USD continues rising after US core PCE beats estimates with fifth up-day in a row

AUD/USD trades in the 0.6540s as it continues rallying after the release of US core Personal Consumption Expenditures Price (PCE) Index data for March.
New
update2024.04.26 22:42

Disclaimer:arw

All information and content provided on this website is provided for informational purposes only and is not intended to solicit any investment. Although all efforts are made in order to ensure that the information is correct, no guarantee is provided for the accuracy of any content on this website. Any decision made shall be the responsibility of the investor and Myforex does not take any responsibility whatsoever regarding the use of any information provided herein.

The content provided on this website belongs to Myforex and, where stated, the relevant licensors. All rights are reserved by Myforex and the relevant licensors, and no content of this website, whether in full or in part, shall be copied or displayed elsewhere without the explicit written permission of the relevant copyright holder. If you wish to use any part of the content provided on this website, please ensure that you contact Myforex.

  • Facebook
  • Twitter
  • LINE

Myforex uses cookies to improve the convenience and functionality of this website. This website may include cookies not only by us but also by third parties (advertisers, log analysts, etc.) for the purpose of tracking the activities of users. Cookie policy

I agree
share
Share
Cancel